ICS-209-Plus
Virginia Iglesias, ESIIL Data Scientist 2023-05-21
This is an all-hazards data set mined from the US National Incident Management System (1999-2020). You can find more information here).
In R, we need 2 packages to download and visualize the data. First, check if the packages are already installed. Install them if they are not:
packages <- c("tidyverse", "httr")
new.packages <- packages[!(packages %in% installed.packages()[,"Package"])]
if(length(new.packages)>0) install.packages(new.packages)
Then, load them:
lapply(packages, library, character.only = TRUE)
Download the data set containing wildfire information:
url <- "https://figshare.com/ndownloader/articles/19858927/versions/3"
ics <- GET(url)
data_file <-"ics.zip"
writeBin(content(ics, "raw"), data_file)

# Unzip the file
unzip(data_file)
unzip('ics209plus-wildfire.zip')
Read the data set:
csvs <- list.files('ics209plus-wildfire',
                   full.names = T)[5]
ics <- read.csv(csvs)
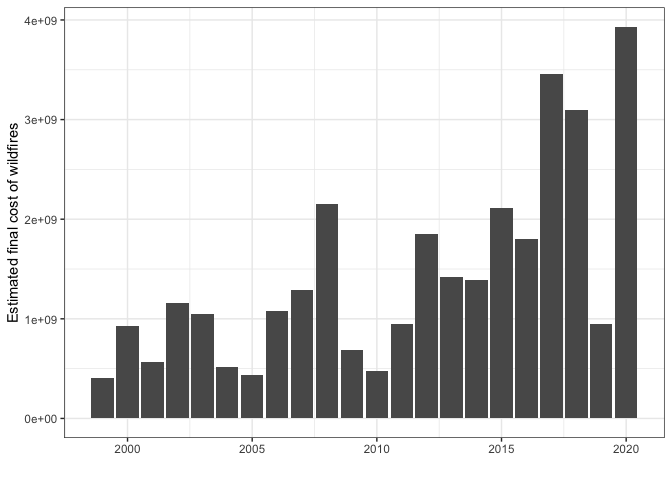
Calculate the annual cost of wildfires and plot:
ics_sum  <-  ics %>%
  group_by(START_YEAR) %>%
  summarise(cost = sum(PROJECTED_FINAL_IM_COST, na.rm = T))

ggplot(ics_sum) +
  geom_bar(aes(START_YEAR, cost),
           stat = 'identity') +
  theme_bw() +
  xlab("") +
  ylab("Estimated final cost of wildfires")
In Python, we need 6 libraries to download and visualize the data.
import requests
import zipfile
import matplotlib.pyplot as plt
import pandas as pd
import os
import glob
Download the data set containing wildfire information:
url = "https://figshare.com/ndownloader/articles/19858927/versions/3"
ics = requests.get(url)
data_file = "ics.zip"
with open(data_file, 'wb') as f:
    f.write(ics.content)

# Unzip the file
with zipfile.ZipFile(data_file, 'r') as zip_ref:
    zip_ref.extractall()
with zipfile.ZipFile('ics209plus-wildfire.zip', 'r') as zip_ref:
    zip_ref.extractall()
Read the data set:
csvs = glob.glob('ics209plus-wildfire' + '/*')[8]

ics = pd.read_csv(csvs, low_memory = False)
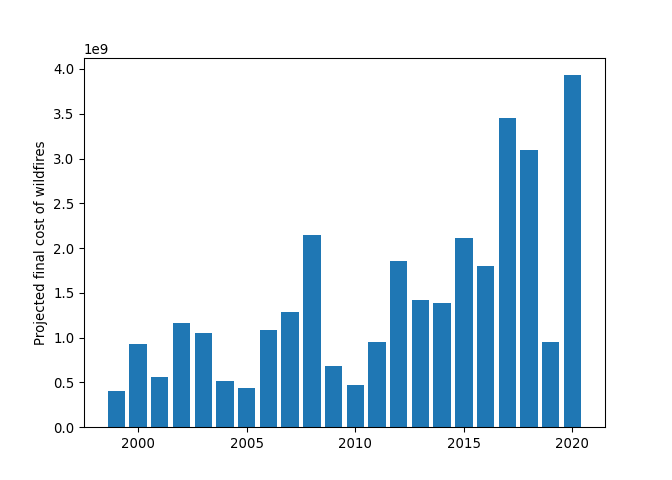
Calculate the annual cost of wildfires and plot:
ics_sum = ics.groupby('START_YEAR').agg(cost=('PROJECTED_FINAL_IM_COST', 'sum')).reset_index()

plt.figure()
plt.bar(ics_sum['START_YEAR'], ics_sum['cost'])
plt.xlabel("")
plt.ylabel("Projected final cost of wildfires")
plt.show()
Last update:
2026-06-22