He Sapa Makiyuta EA/EIS Study

Visual 1. Black Hills Map and Active Mining Claims. (Black Hills Clean Water Alliance & Mato Ohitika Analytics LLC)
One sentence on impact: Tribal groups want to collaborate to create pragmatic tools to better understand information to protect their land, resources, and sovereignty.
Draft project brief (PDF/A) · View shared code · Explore data
About this site: This is a public, in-progress record of Innovation Summit Team 20. Update anything here in your browser: open a file → pencil icon → Commit changes. The page is structured so we can talk through the project in under two minutes.
Day 1 — Define & Explore
Our product 📣
- A dashboard/interactive search tool to more easily comb through 2,400 Environmental Impact Statement/Assessment documents from the US Forest Service, US NRC, BLM, etc.
Our question(s) 📣
- How can we create a tool for non-technical tribal decision-makers to access and understand meaningful information about extractive activities in the HeSapa through EIAs?
Hypotheses / intentions
Why this matters (the “upshot”) 📣
- HeSapa is sacred land to tribes and exposed to extractives activities
- The information will be accessible to non-technical audiences
- Supports corporate accountability & transparency; environmental justice; and treaty rights around extractive activities in the HeSapa
Inspirations (papers, datasets, tools)
Field notes / visuals

Day 2 — Data & Methods
Focus: tribal engagement to identify key indicators of concern, human-review of a typical EIS, metadata capture, intial steps of PDF extraction.
Data sources we’re exploring 📣
- Public documents (PDFs) such as Environmental Impact Statements and Assessments from agencies such as Forest Service, EPA, US NRC, BLM.
 Raw photo location: explore_data_plot.png
Snapshot: EIS for the Dewey-Burdock Project for In-Site Leach Uranium Milling Facilities.
Raw photo location: explore_data_plot.png
Snapshot: EIS for the Dewey-Burdock Project for In-Site Leach Uranium Milling Facilities.

Visual 2. Potential chemicals and their risk from Dewey Burdock Project.
Methods / technologies we’re testing 📣
- Engagement: Engaged with the tribal members to identify key indicators of concern and desired product output.
- Centralize and Structure the Data:
- PDF Extraction: Use Python/R to extract relevant test from PDFs.
- Metadata capture: For each EIS/EA document determine the most relevant information to capture:
- Document title
- Agency names
- Company name(s)
- Geographical project location/coordinates
- Type of extractive activity (e.g., mining, forestry)
- Byproducts from extractive activities (e.g., contaminants or residues)
- Key environmental impact categories
- Spreadsheet/Database: Store this data in a structured format (CSV) so it can be filtered and searched.
- Automate Key Information Extraction:
- Create training set for any LLM models.
- Keyword Tagging: Use models to flag mentions of relevant fields.
- Build a Long-Term Knowledge Sharing Base
- Build a dashboard that can tribal leaders can use for more evidence-based decision-making.
- Overlay project sites (pending necessary geograhpical coordinate data) to visualize where activities intersect with culturally and ecologically sensitive areas.
Challenges identified
- Missing information: Certain projects were waived from creating EIS/EA for categorical exclusion.
- If any PDFs are not machine-readable, integrate OCR.
- Writing a generalized code that can effectively parse through PDFs of various formats to capture necessary data.
- Does the language used in the metadata schema reflect tribal community values?
Final Share Out — Insights & Sharing
Visuals that tell the story 📣
He Sapa Relatives: - 🌎 Row 1 L-R: Psipiza (Prairie Dog), Ojinjintka Hu (Prairie Rose), Tatoka (Antelope) - 🌎 Row 2 L-R: Icahpe Hu (Purple Coneflower), Wahpe Hinsma (Mullein) - 🌎 Row 3 L-R: Canpa (Chokecherry Bush), Unkcekhiha (Black-billed Magpie), Pejihota (Sage)
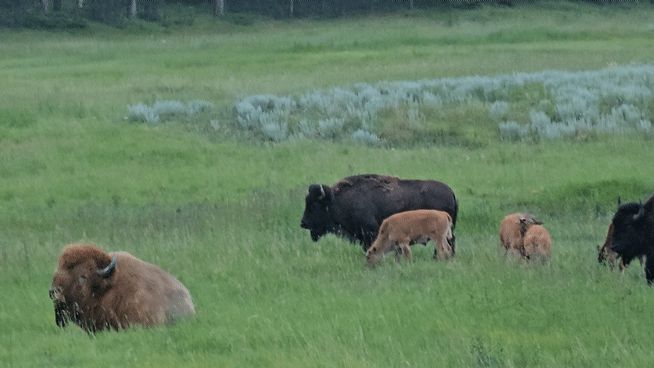
Tatanka (Buffalo)
Findings at a glance 📣
- Key priority areas for tribes: Impact of extractive activities on historical resources, cultural sites, wildlife (bison), water bodies, soil, air, plant life, and broader ecosystems
- Test and refine workflow with a handful of human-reviewed EIS/EAs: human review of PDFs compares to machine-generated PDF parse results for accuracy and quality.
- Deeper Knowledge of the Land: Work with tribal partners to understand the language of the land.
What’s next? 📣
- Refine the PDF search tools, LLM, etc.
- Broader group: ESIIL Working Group & CU Boulder Research & Innovation Seed Grant Program
Featured links (image buttons)
 Read the brief |
 View code |
 Explore data |
Team
- Alicia Swimmer
- Sylwia Zieba
- Keiko Nomura
Storage
Code
Documentation
Cite & reuse
If you use these materials, please cite:
He Sapa Makiyuta EA/EIS Study. (2025). He Sapa Makiyuta EA/EIS Study Innovation Summit 2025 Repository. https://github.com/CU-ESIIL/wildcard-topic-innovation-summit-2025__20
License: CC-BY-4.0 unless noted. See dataset licenses on the Data page.
<!-- EDIT HINTS - Upload images to docs/assets/ and reference as assets/filename.png