Home
CMSMapper: Optimal climate mitigation planning for nature and people
Welcome to the CMS Mapper ESIIL working group page. Here you will find the proposed goals, activities and updates from this initiative.
Working Group Abstract
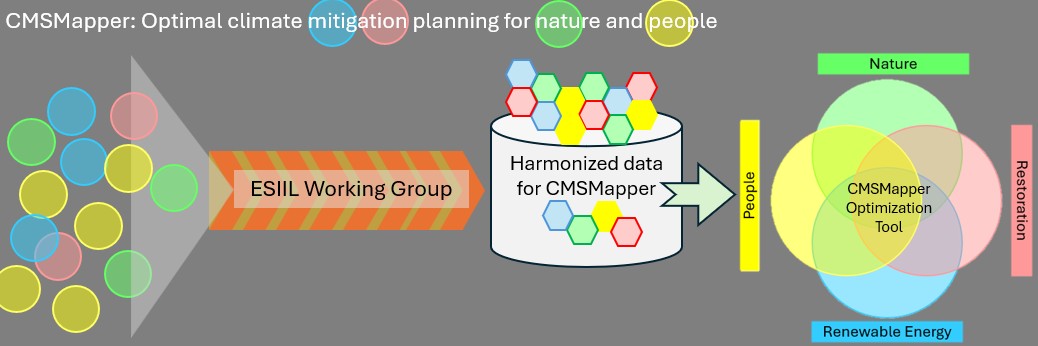
CMSMapper is a multidisciplinary working group with the aim of developing an integrative strategy for optimal siting of climate mitigation strategies (CMS) that minimizes land use incompatibilities and bolsters potential benefits for nature and people in the U.S. In the first developmental stage of CMSMapper, the group will review and synthesize the trade-offs between competing land use needs for CMS across U.S. regions and harmonize big environmental data that informs CMS placement across disciplinary boundaries that can be compatible and useful for actionable knowledge. The aim is to provide a foundation of synthesized trade-offs, data products, and tools that could inform decision-making prior to the deployment of both renewable energy and restoration projects. Our findings will be integrated into a spatial optimization framework that allows stakeholders to evaluate scenarios for implanting CMS depending on outcomes to biodiversity conservation, climate, and socio-economic issues.
Working Group PIs
Evelyn Beaury (New York Botanical Garden), Laura Nunes (Defenders of Wildlife)
Context
The U.S is amid two environmental crises: a climate crisis due to rising carbon emissions and a biodiversity crisis due to unprecedented ecosystem degradation driving loss of species. At the same time, economic and technological growth demands higher energy production. The expansion of the U.S energy grid must co-occur within a landscape matrix that also considers climate and biodiversity priorities. Alongside these land use trade-offs, there is also a need to consider consequences of land use planning on socio-economic issues such as human health, livelihood and social inequities. Activities to reduce or sequester carbon emissions, or climate mitigation strategies (CMS) are essential to address the climate crisis with some CMS, such as ecological restoration, also having benefits to biodiversity. Over the years, there has been growing literature on the interactions between CMS, nature and people. However, these disparate datasets have not been reconciled for decision making across regions in the U.S. The development of evidence-based guidance on optimal CMS planning requires cross-sectoral expertise, data synthesis, and the production of open, harmonized data products.
Proposed Activities
Proposed Activity 1: Data synthesis on interactions between CMS, nature and people
Conservation values and interests are not homogenous across the U.S., nor are energy needs and land-use constraints. Here, we aim to identify points of tensions between multiple land use demands across U.S. regions, by outlining the main axes of tradeoffs between land management practices for CMS (e.g., renewable energy and ecological restoration), biodiversity conservation and supporting economically disadvantaged or vulnerable communities. To achieve this goal, we will engage in 3 sub-activities: 1) Conduct a systematic scoping review to synthesize risks and trade-offs between CMS (terrestrial solar or wind energy vs restoration), biodiversity conservation and disadvantaged or vulnerable groups across U.S 2) Collate all relevant literature into a curated, open repository 3) Develop an interactive visualization tool that informs the public on the major risks and opportunities among different land management practices (CMS, conservation and socio-economic activities) across regions of the U.S.
Proposed Activity 2: Harmonization of big socio-environmental data for CMS siting
We aim to develop a reproducible framework that integrates socio-economic variables and biodiversity conservation priorities into suitability assessments of CMS siting. To achieve this goal, we will harness a diverse set of big environmental data. These disparate data sources span multiple spatial resolutions (e.g., 1000m,300m, 30m) and data types (gridded rasters, spatial polygons), thus requiring a data harmonization process prior to data analysis. This proposed activity will leverage ESIIL’s CyVerse and Git platforms to develop a reproducible framework for storing and harmonizing these datasets.
Outcomes
The working group aims to generate the following data synthesis outputs: 1) Establish a primer for reproducible harmonization of existing data related to siting of CMS that considers nature and people in the U.S. 2) A synthesis report on gaps and opportunities for optimal spatial planning of CMS considering regional interests and tradeoffs for nature and people in the U.S. 3) An interactive, user-friendly learning tool showcasing the synthesis of the best available data on renewable energy, restoration, and intersection with critical areas for nature and people.
Group Members
| Name | Role | Institution | Responsibilities |
|---|---|---|---|
| Laura Nunes | Co-PI, Tech Lead | Defenders of Wildlife | Responsibilities |
| Evelyn Beaury | Co-PI, Team Lead | New York Botanical Garden | Responsibilities |
Plan the work Document data and resources Set community expectations Open the GitHub repository
Working Group Landmarks
Use these lightweight labels to connect work sessions, meeting notes, and homepage edits:
WG-A People and roles; WG-B Question and scope; WG-C Data and access; WG-D Methods and workflows; WG-E Results and synthesis; WG-F Outputs and handoff.
How This Repo Is Organized
The repository has two connected layers. Top-level files configure the project and its automation. The docs/ folder contains the website content. mkdocs.yml tells MkDocs how to turn that content into the public site. Analysis folders hold the working scientific materials that generate the results shown on the website.
| Part of the repo | What it does | What usually belongs there |
|---|---|---|
| Top-level files and folders | Configure the project and keep shared repository guidance in one place | README.md, LICENSE, workflows, containers, templates, environment setup, and repo-wide metadata |
docs/ |
Stores the source content for the public website | Homepage text, summaries, methods, community-facing documentation, and website assets |
mkdocs.yml |
Controls how the site is rendered | Navigation, theme settings, plugins, and GitHub edit links |
| Working folders | Hold the science-in-progress | Data references, notebooks, scripts, workflows, figures, outputs, and reproducibility materials |
Repository Side: Do the Science

This image represents the repository side of the working group: data, code, workflows, and reproducibility.
To update: delete the current image in this folder and upload one new square image. Use a flat, minimal, screen-print style graphic with no text.
Delete this note after the site is customized.
Related landmarks: WG-C Data and access; WG-D Methods and workflows.
The repository is the working record of the group: it tracks what changed, why it changed, and how results were produced.
- Data sources and metadata
- Notebooks and scripts
- Workflows and reproducible analysis
- Meeting notes and decisions
- Figures, tables, and other outputs
Website Side: Share the Science

This image represents the website side of the working group: summaries, maps, figures, and public communication.
To update: delete the current image in this folder and upload one new square image. Use a flat, minimal, screen-print style graphic with no text.
Delete this note after the site is customized.
Related landmarks: WG-E Results and synthesis; WG-F Outputs and handoff.
The website turns the working group record into a readable public report.
- Plain-language summaries
- Methods documentation
- Figures, maps, and visualizations
- Meeting outputs and synthesis products
- Manuscripts, reports, or educational materials
How the Two Sides Connect
The repository and website are not separate products. When the group updates data, analysis code, figures, or written summaries in GitHub, those changes can be rendered through the website. Commits are the bridge between doing the science and sharing the science.
When This Working Group Is Live
A working group is live when:
- The research question is stated
- Data sources are linked or documented
- At least one analysis or workflow is runnable
- Outputs are committed to the repository
- The website explains what the group is doing and why it matters
For guidance on turning this scaffold into a public scientific record, see the Public-Facing Site Guide.
Early Process Gallery
Use this section to show how the working group gets started without manually editing image links one by one.

This gallery displays early setup artifacts for the working group.
Add or replace files in this gallery
To update: upload supported files to this folder and commit. The website sorts files alphabetically. Use this folder for kickoff notes, orientation screenshots, starter diagrams, and early planning visuals.
Delete this note after the site is finalized.
Key Links to Replace
Use this section for the links your group will actually maintain. Replace each placeholder with the working document, repository resource, dataset hub, or output page that your collaborators should use.
- Main Working Document: [link]
- GitHub Repository: [link]
- Data / Resources: [link]
- Outputs / Dashboard: [link]
Current Phase
Working Phase: Preparing for Meeting 1
(Replace this line with the phase your group is actually in, such as working asynchronously, preparing outputs, or revising a manuscript.)
Team Members
Replace this table with names, roles, institutions, and responsibilities so new collaborators know who is doing what.
Related landmark: WG-A People and roles.

This image represents collaboration, team identity, or a real working group photo.
To update: delete the current image in this folder and upload one new image. A real group photo is welcome here, but an abstract collaboration image also works.
Delete this note after the site is customized.
| Name | Role | Institution | Responsibilities |
|---|---|---|---|
| Name | Role | Institution | Responsibilities |
| Name | Role | Institution | Responsibilities |