How to use this page during the Summit
-
This page is your team’s shared workspace and final report-out page. It captures your group’s process and thinking throughout the Summit and will be used to share your work with others.
-
Use this page as your team’s working record during the Summit and your final report-out.
-
The Summit has several different goals and thus you will use the page differently each day: Day 1 is for alignment, Day 2 is for building one useful thing, and Day 3 is for synthesis and report- out.
-
Look for the green buttons to indicate what you need to edit.
-
Megaphones 📣 indicate which items you will be presenting during the end-of-day report-outs.
-
Only the items with megaphones will be visible when you hit the 'Summit Report Out' button.
-
If you turn off 'Instructions' then you will only see the page content for public display.
Team 1 Home: Energy Usage Reporting as a Performance Metric in Environmental Data Science
How to replace the image above
Upload an image that represents your project and welcome people to your page.
Upload your own image to docs/assets/hero/ and replace the file named hero.png. Use a wide image if you can, then refresh the site preview to check how it looks.
Keep the file path docs/assets/hero/hero.png if you want the Markdown above to keep working.
People
| Name | Affiliation | Contact | Github | OrcID |
|---|---|---|---|---|
| Rachel Peterson | CU Boulder / NOAA | rachel.peterson-3@colorado.edu | https://github.com/r-petes | https://orcid.org/0009-0007-2048-8268 |
| Dylan Van Bramer | University of Toronto | dylan.vanbramer@mail.utoronto.ca | https://github.com/dylancvb | https://orcid.org/0009-0005-1866-4061 |
| Bea Bock | NAU / USDA | bmb646@nau.edu / beabockm@gmail.com | https://github.com/beabock | https://orcid.org/0000-0003-2240-9360 |

Team Norms and Decision Making
Day 1 task
Suggested Self-Facilitation Instructions:
-
Round Robin: Everyone shares 1 norm that they think will be important for their team during the Summit and perhaps following the Summit (2 min).
-
After everyone has shared, make a list with as many norms as possible in GitHub (5–7 min).
-
Vote on your top 3 ideas. (Each person gets 3 votes; you can use all your votes on 1 idea or spread them out) (2 min).
-
In GitHub, move all team norms with votes to the top of the list.
| Gradients of agreement |
|---|
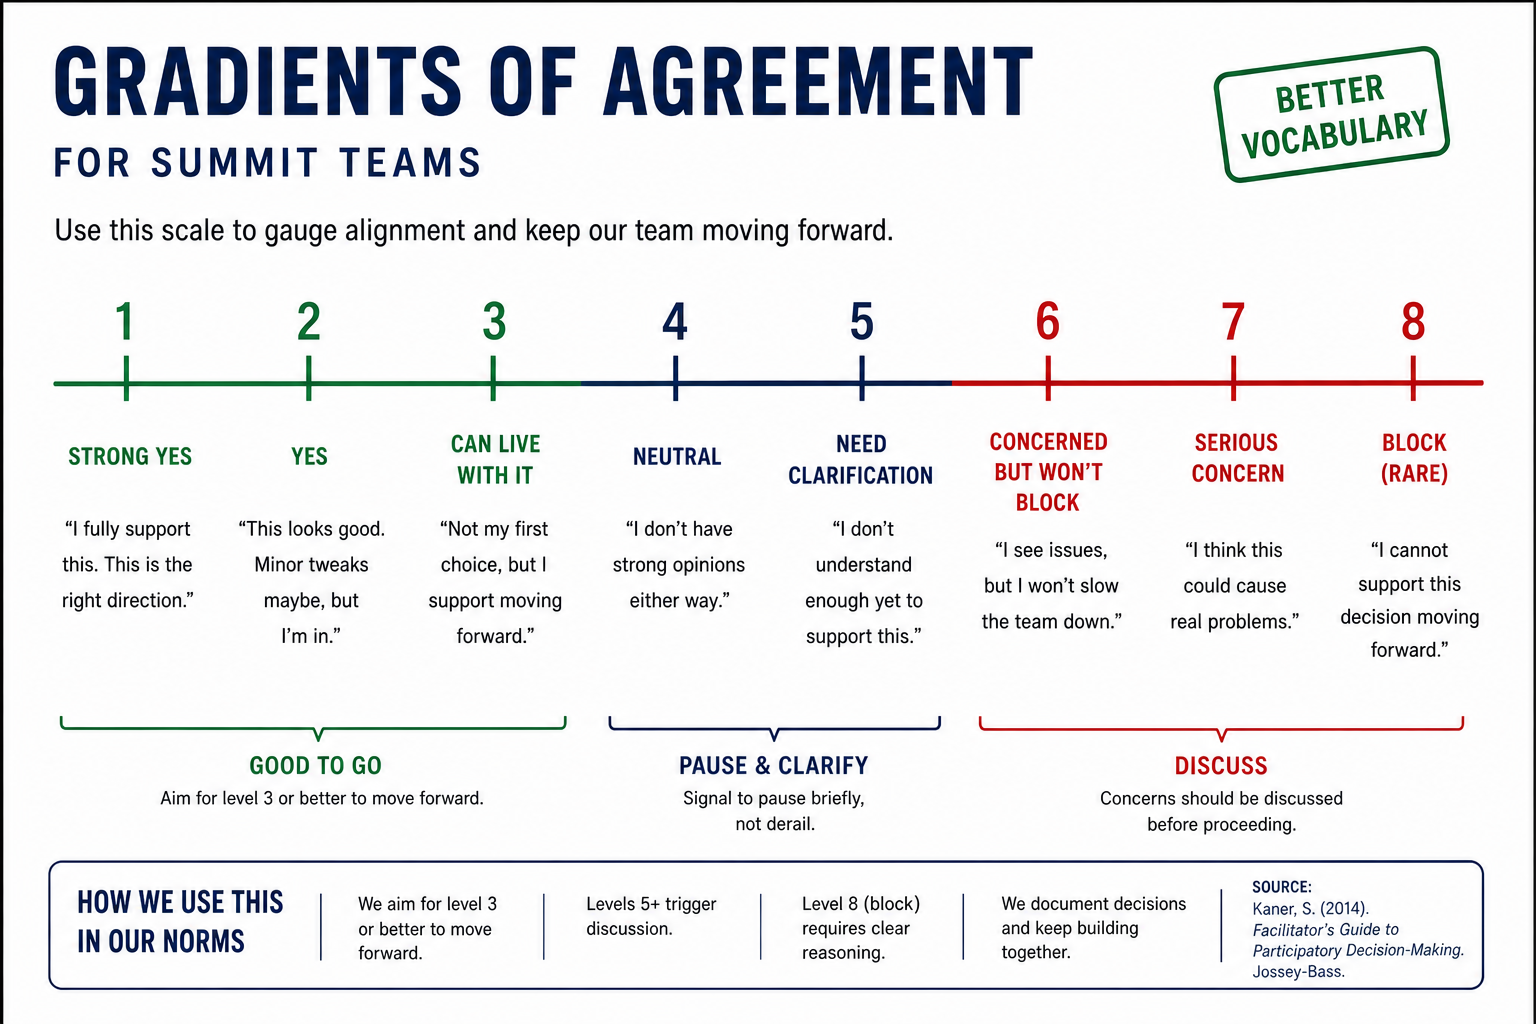 |
Our team norms:
AI - Keeping track of how we use it: - keep track of prompts - keep all convos with LLMs in one thread when possible so we can easily keep track - Drafting full prose -- no using AI - Report environmental impact of our paper in terms of AI usage
Decision-making: - Voting - Spectrum of how much we agree/disagree - vetos are allowed
Even turn-taking: - Let people finish their sentences
Ask questions: - No stupid questions - What's shared here stays here, what's learned here leaves here - Write down questions as often as possible
Reflection points: - Check-ins often on how we're feeling/what we're doing, going back to guiding questions
Expectations: - Clear about what we are doing and by when, what our capacities are
Communication: - Slack channel - Turn on notifications (or whatever feels best for you)
What a final product looks like: - Being transparent about if we think something is not good enough
Our product(s) 📣
Day 2 Tasks
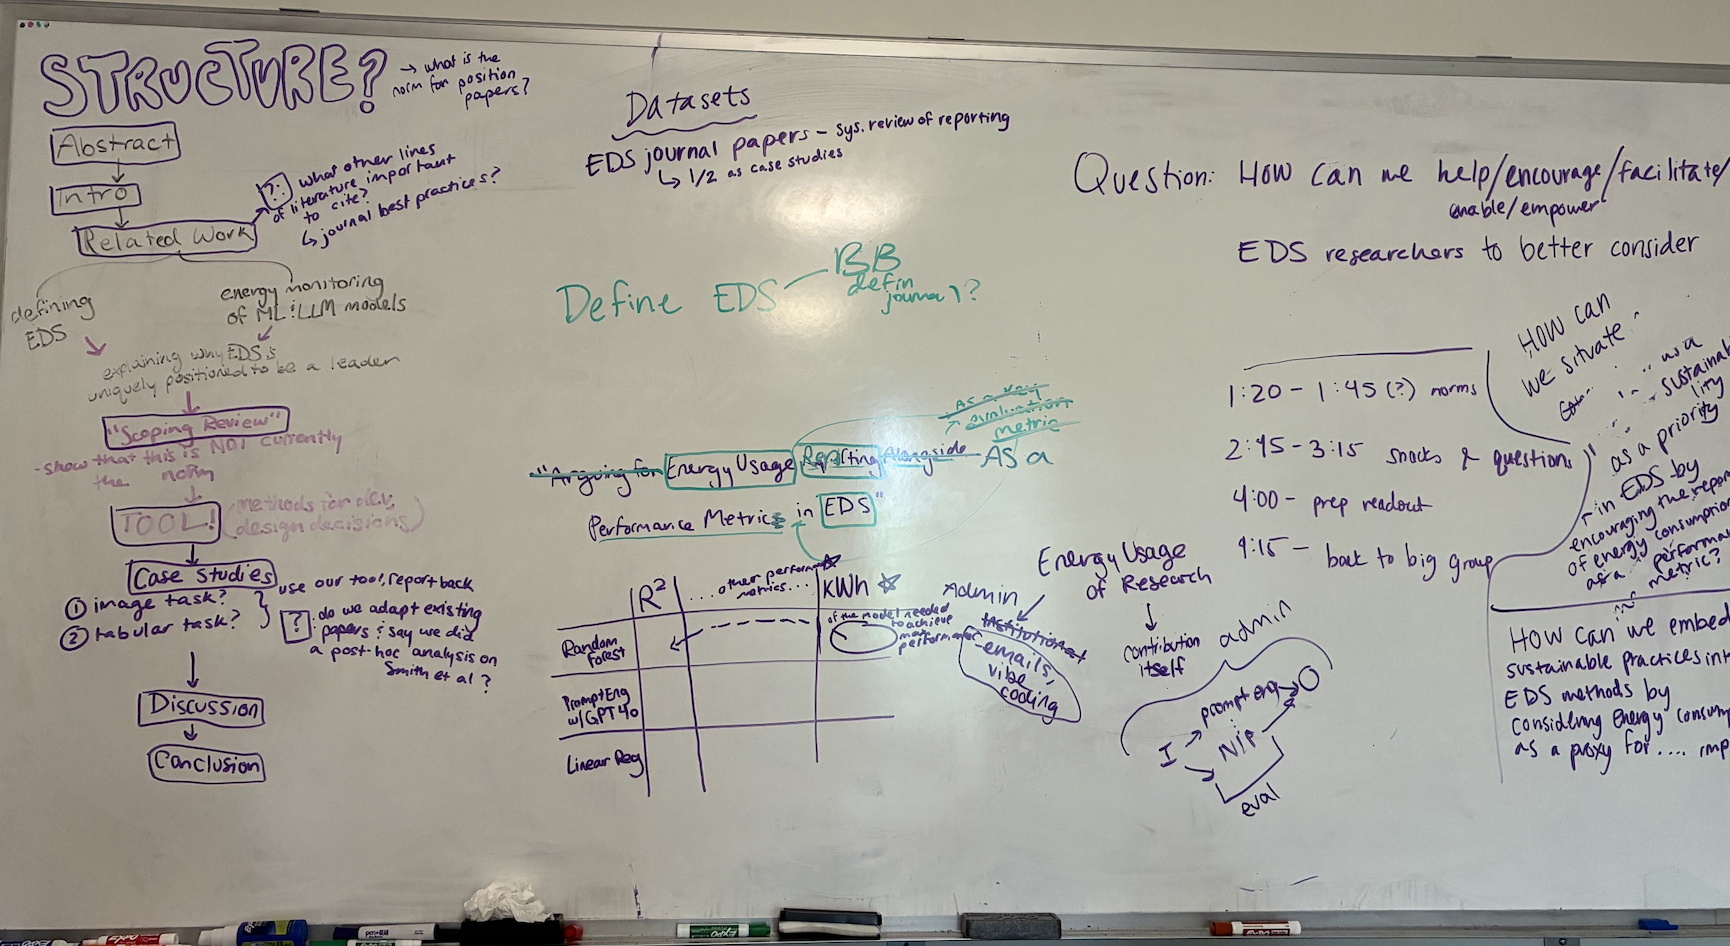
Morning Focus: questions, hypotheses, context; add at least one visual (photo of whiteboard/notes)
Afternoon Focus: try a few datasets and analyses. Keep it visual, keep it simple. Update the site to reflect what you test.
We plan to write a position paper proposing that researchers in the fields of environmental data science should incorporate consideration of the energy costs of modeling choices alongside other performance metrics, including creating a prototype of a "calculator" for the most common analytical methods within the field to make this reporting process streamlined.
Our question(s) 📣
How can we situate environmental sustainability as a priority in environmental data science by encouraging the reporting of energy consumption as a performance metric?
Hypotheses/Intentions
We expect that it is not the norm to include information about considering energy consumption or other sustainability metrics in reporting about methodological choices for environmental data science / analysis.
Why this matters (the “upshot”) 📣
This matters because:
Environmental data scientists are uniquely positioned to be leaders in creating holistic decision-making processes incorporating sustainability metrics when using AI or other analytical tools.
People who could use this:
Environmental data scientists, or scientists in other domains concerned with holistic research method decision-making.
Data sources we’re exploring 📣
data exploration
Provide a snapshot showing some initial data patterns.
Add 2-4 promising data sources (links +1-line notes)
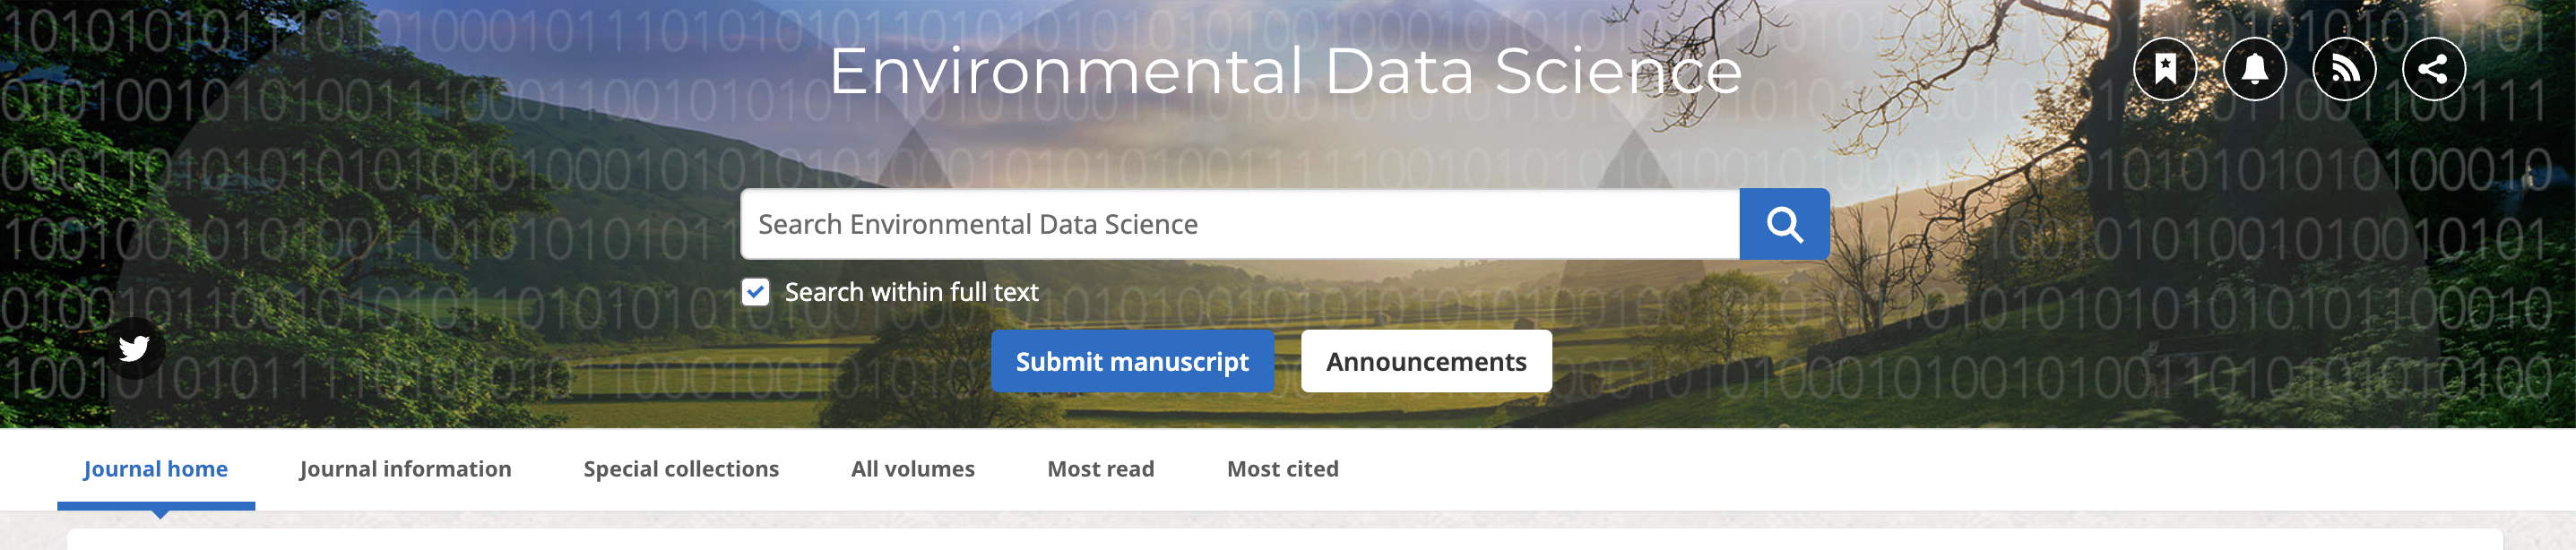
Investigating the norms in current reporting in the Environmental Data Science journal, with 1-2 as case studies with the tool.
Next Steps
Short term: - Spend 20 minutes each going through 2-3 articles - Agree on definitions - environmental data science, models, anything else? - Nail down calculations - Tech stack for tool, dev plan (package or website) - Prepare final report back
Long term: - Paper draft - Develop tool - Be happy
Day 3 Tasks
Sythesis: highlight 2-3 visuals that tell the story; keep text crisp. Practice a 6-minute walkthrough of the homepage. Why -> Questions -> Data/Methods -> Findings -> Next
Team Photo
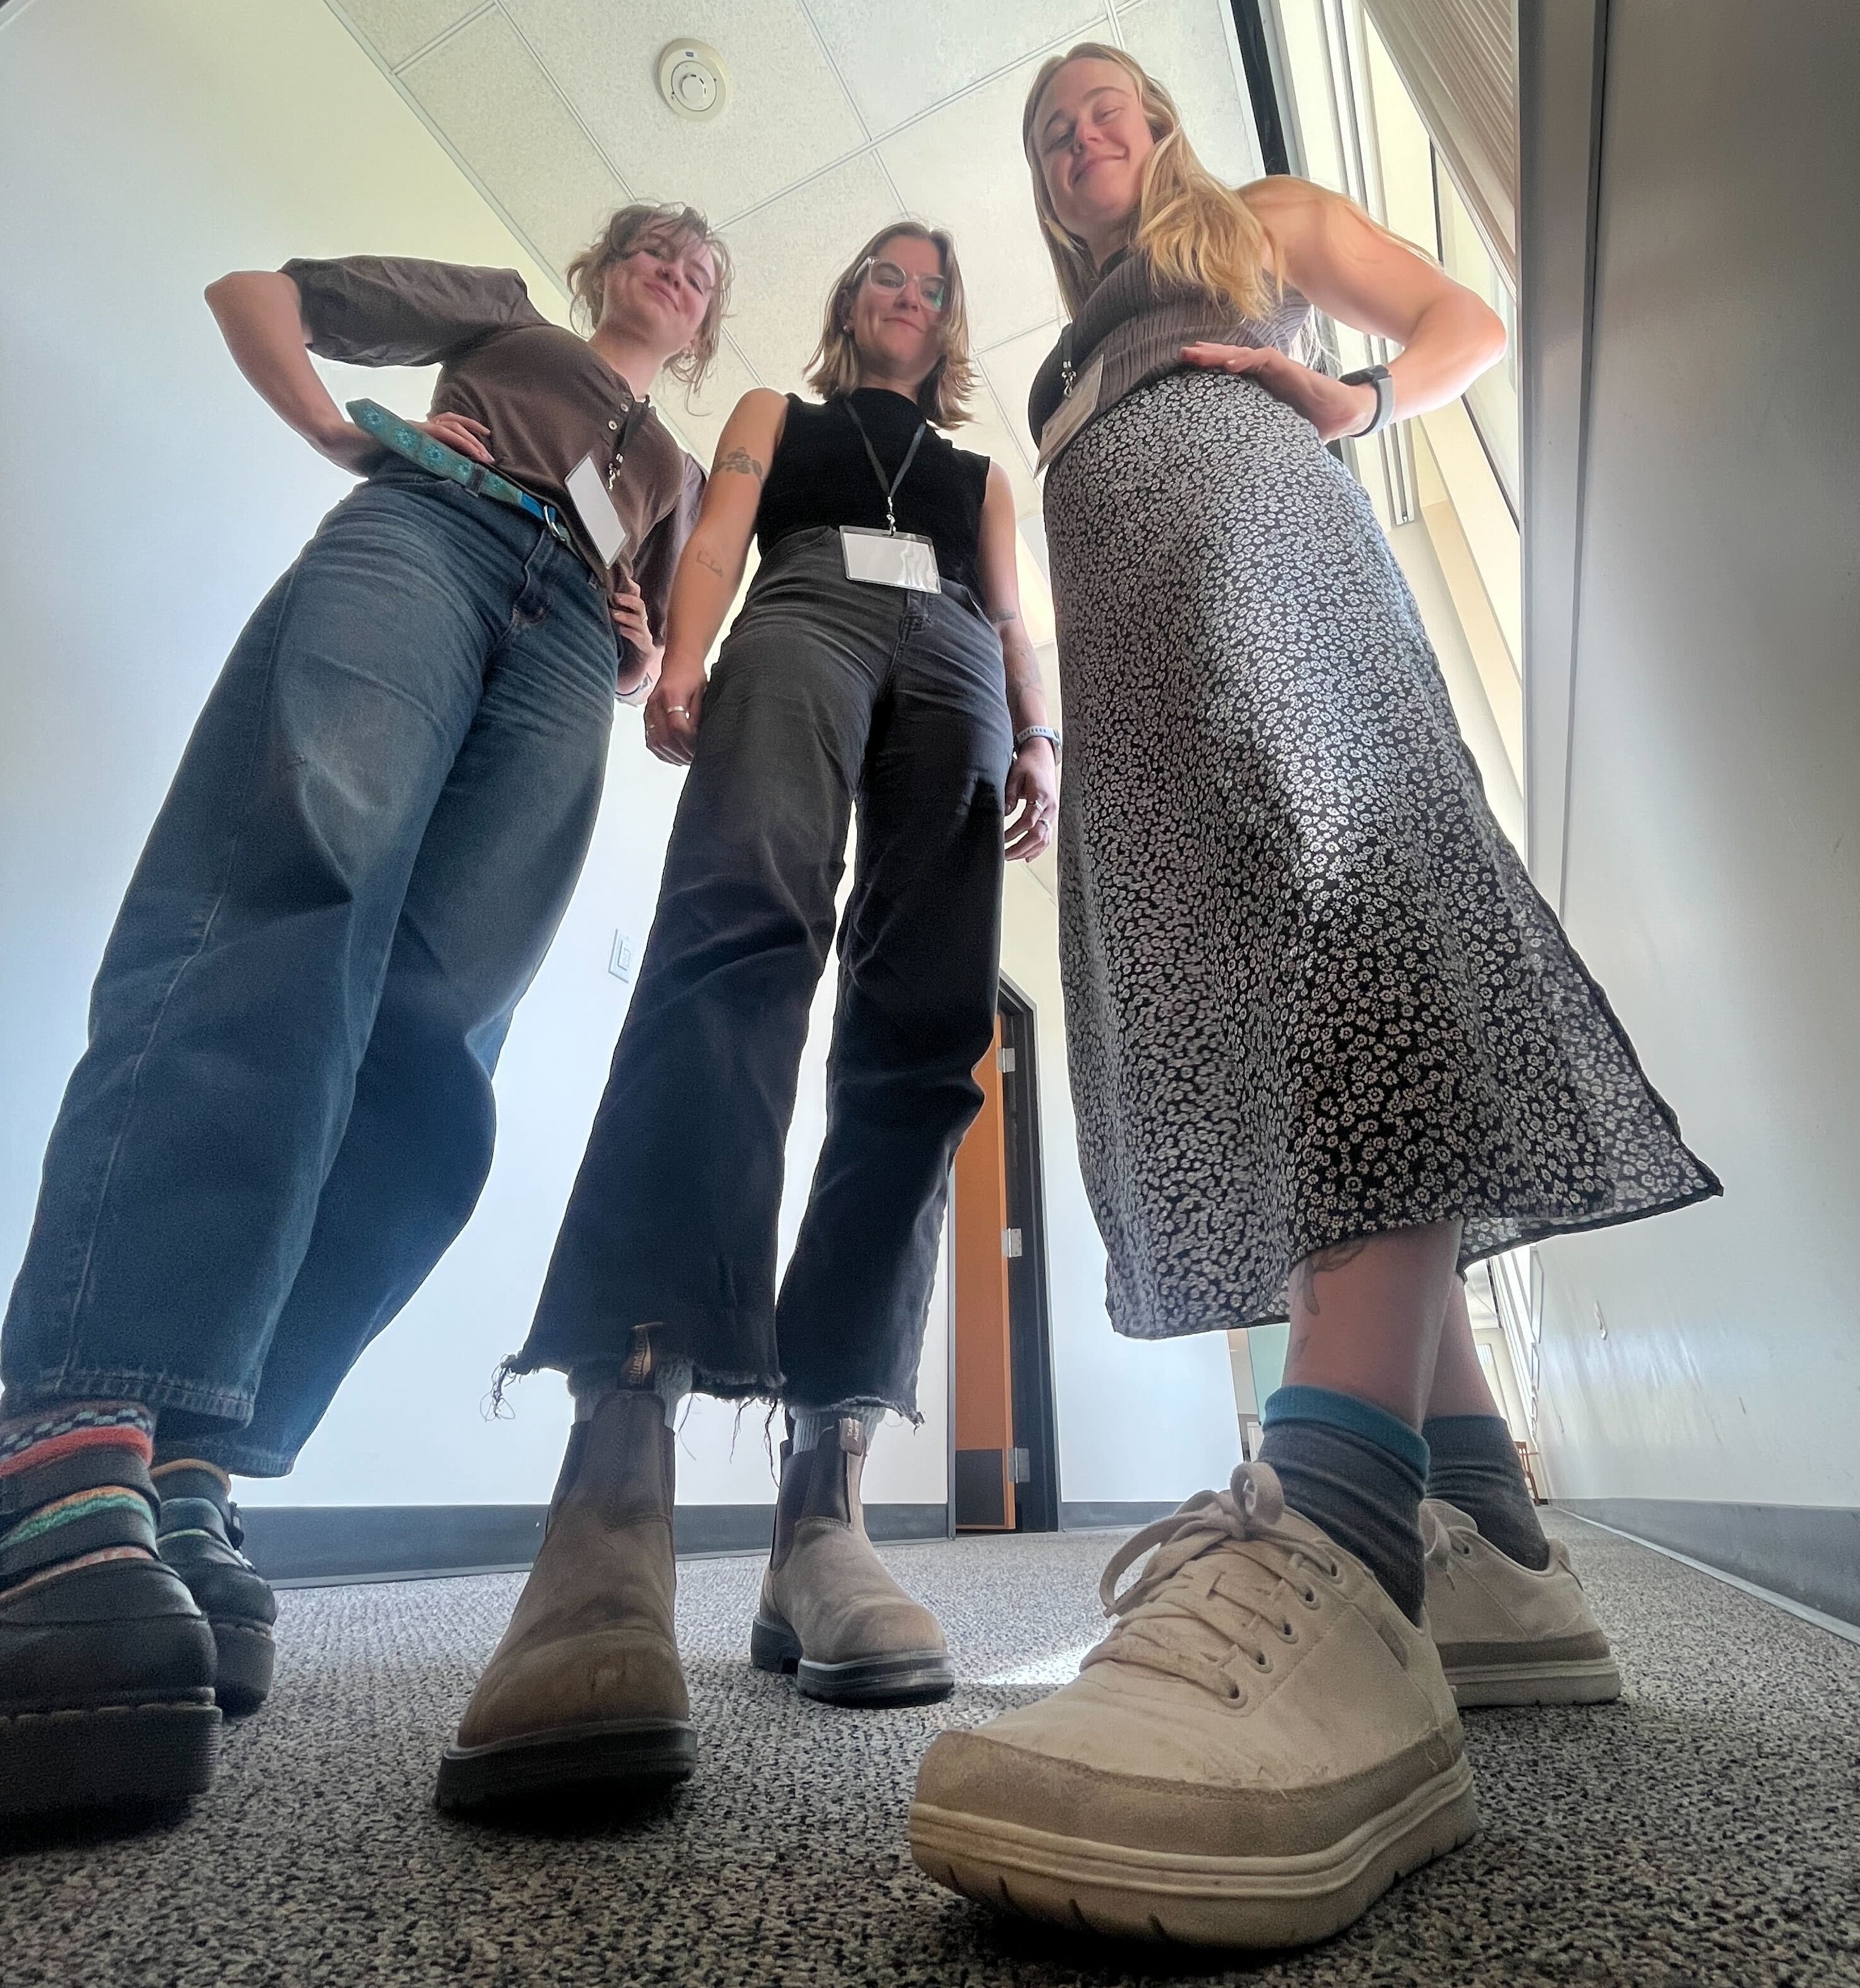
Bea, Dylan, and Rachel!
Findings at a glance 📣
Overview
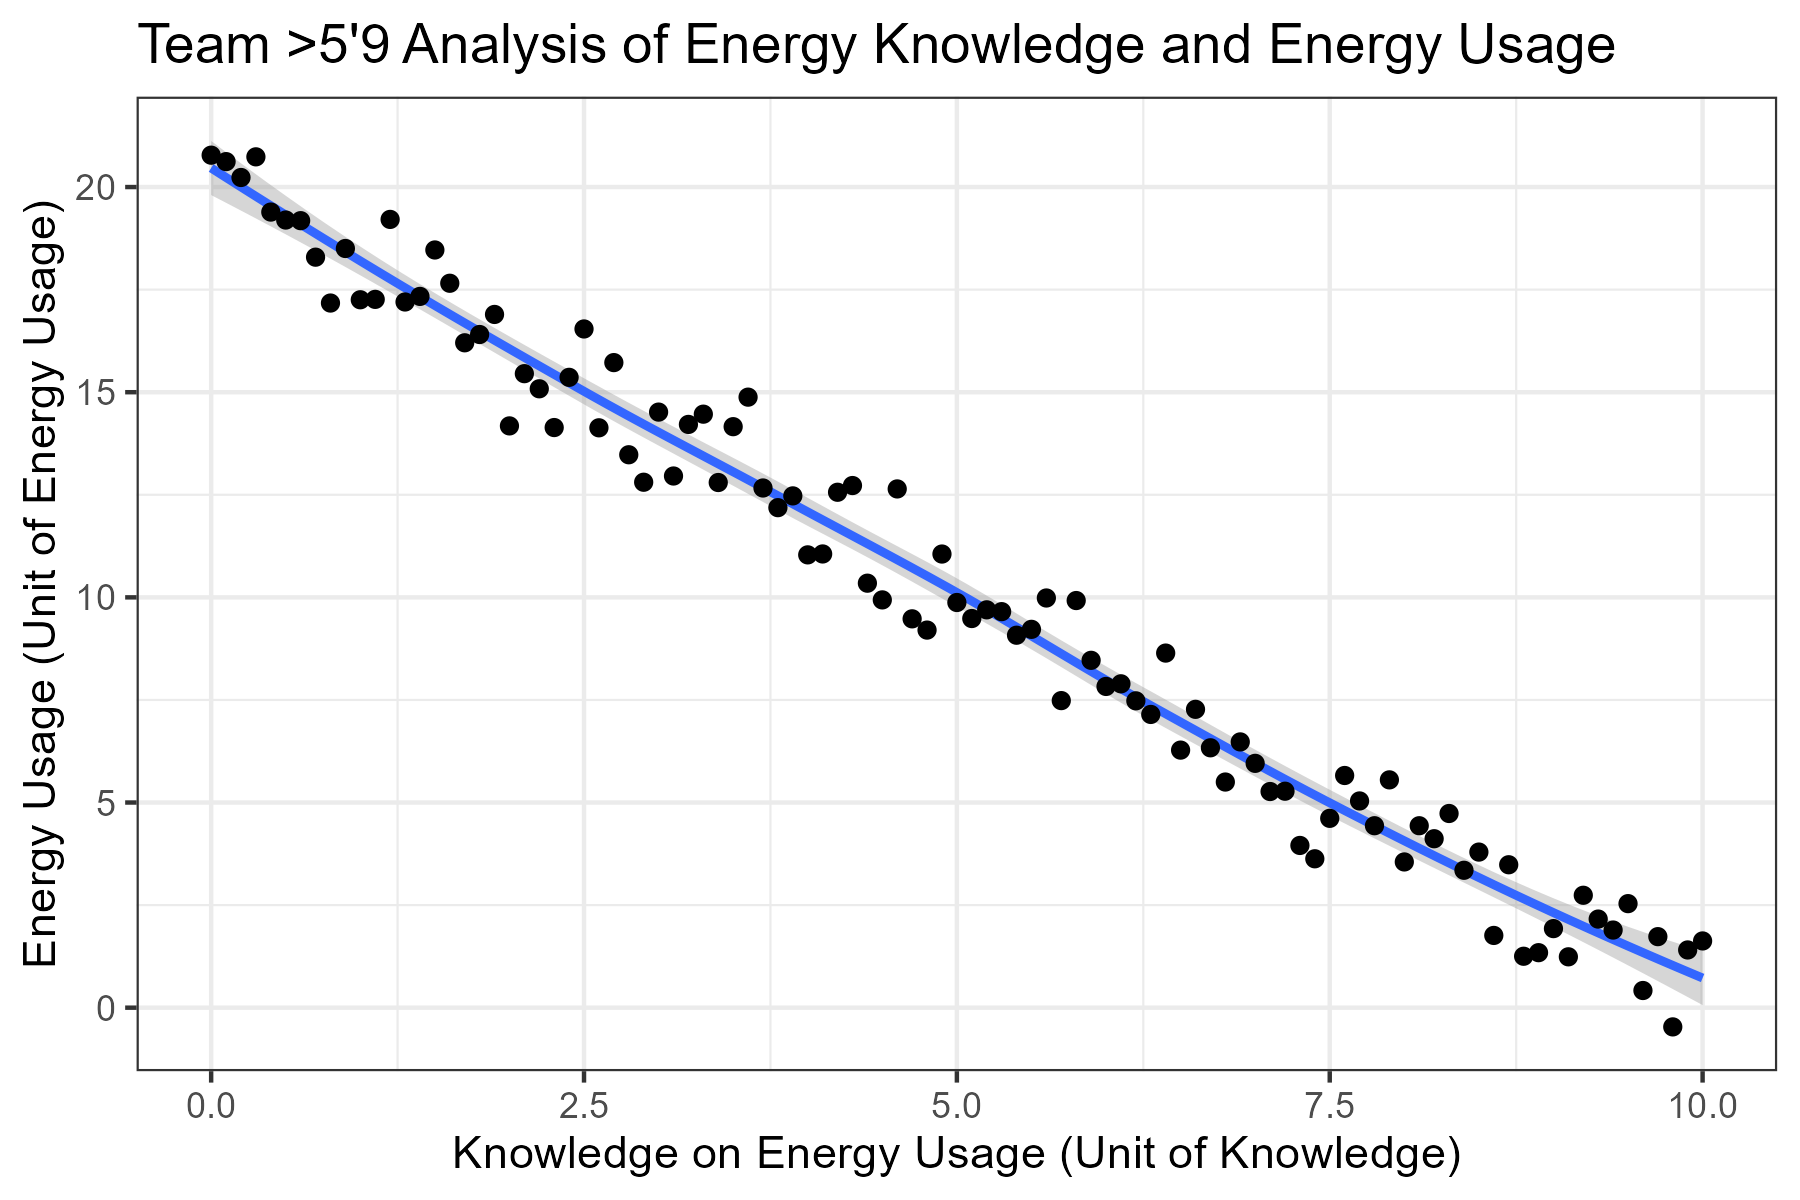 In a recent study, we found a significant inverse, causal relationship between knowledge and energy use (p <0.000000000001, R2 = 1).
Literature Review
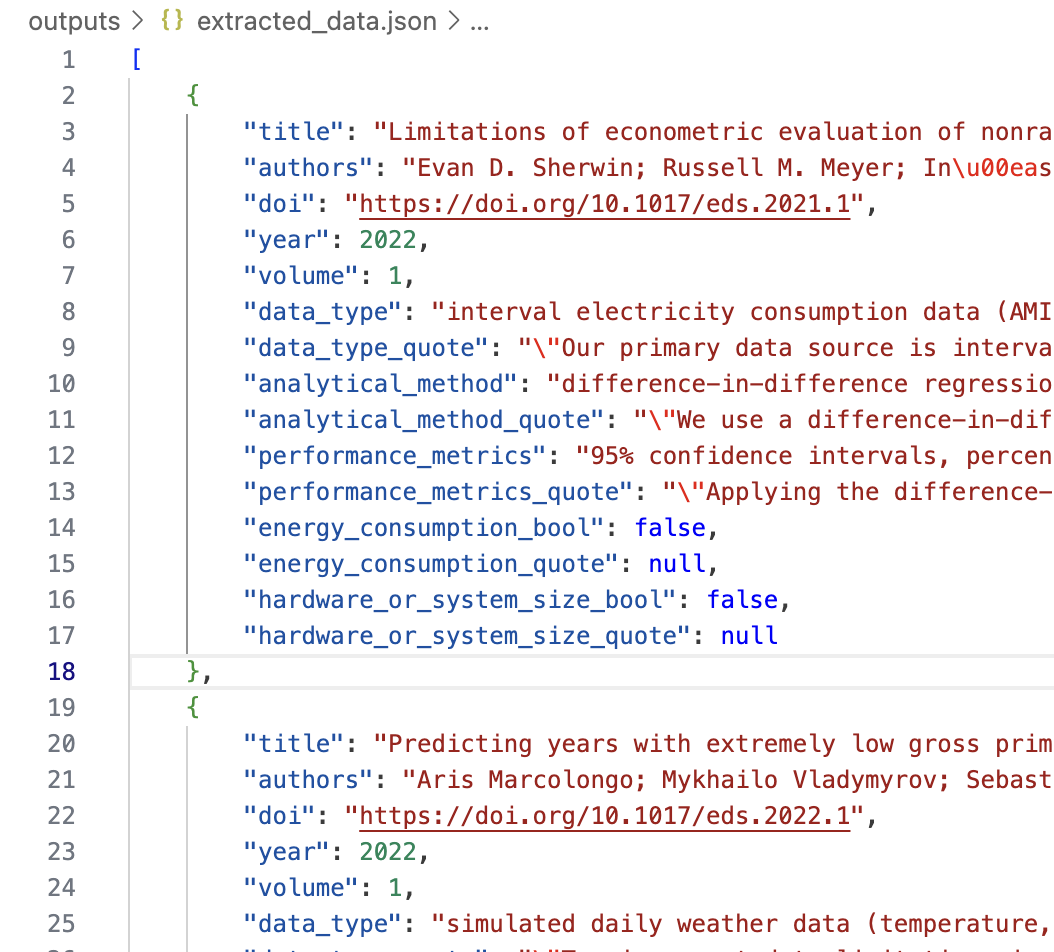
We've conducted a literature review of existing Environmental Data Science journal articles using an agentic repository workflow to assess trends in analytical methods, data types, and reported performance metrics including whether each article references the energy consumption of their analytical method of choice.
Our preliminary literature review demonstrates that energy consumption is not commonly reported in environmental data science articles, however hardware and other performance metrics are often reported. This review reinforces the significance of our work to develop a tool to assist in reporting of energy consumption as a performance metric, and also informs how we can tailor the tool to best suit the environmental data science community.
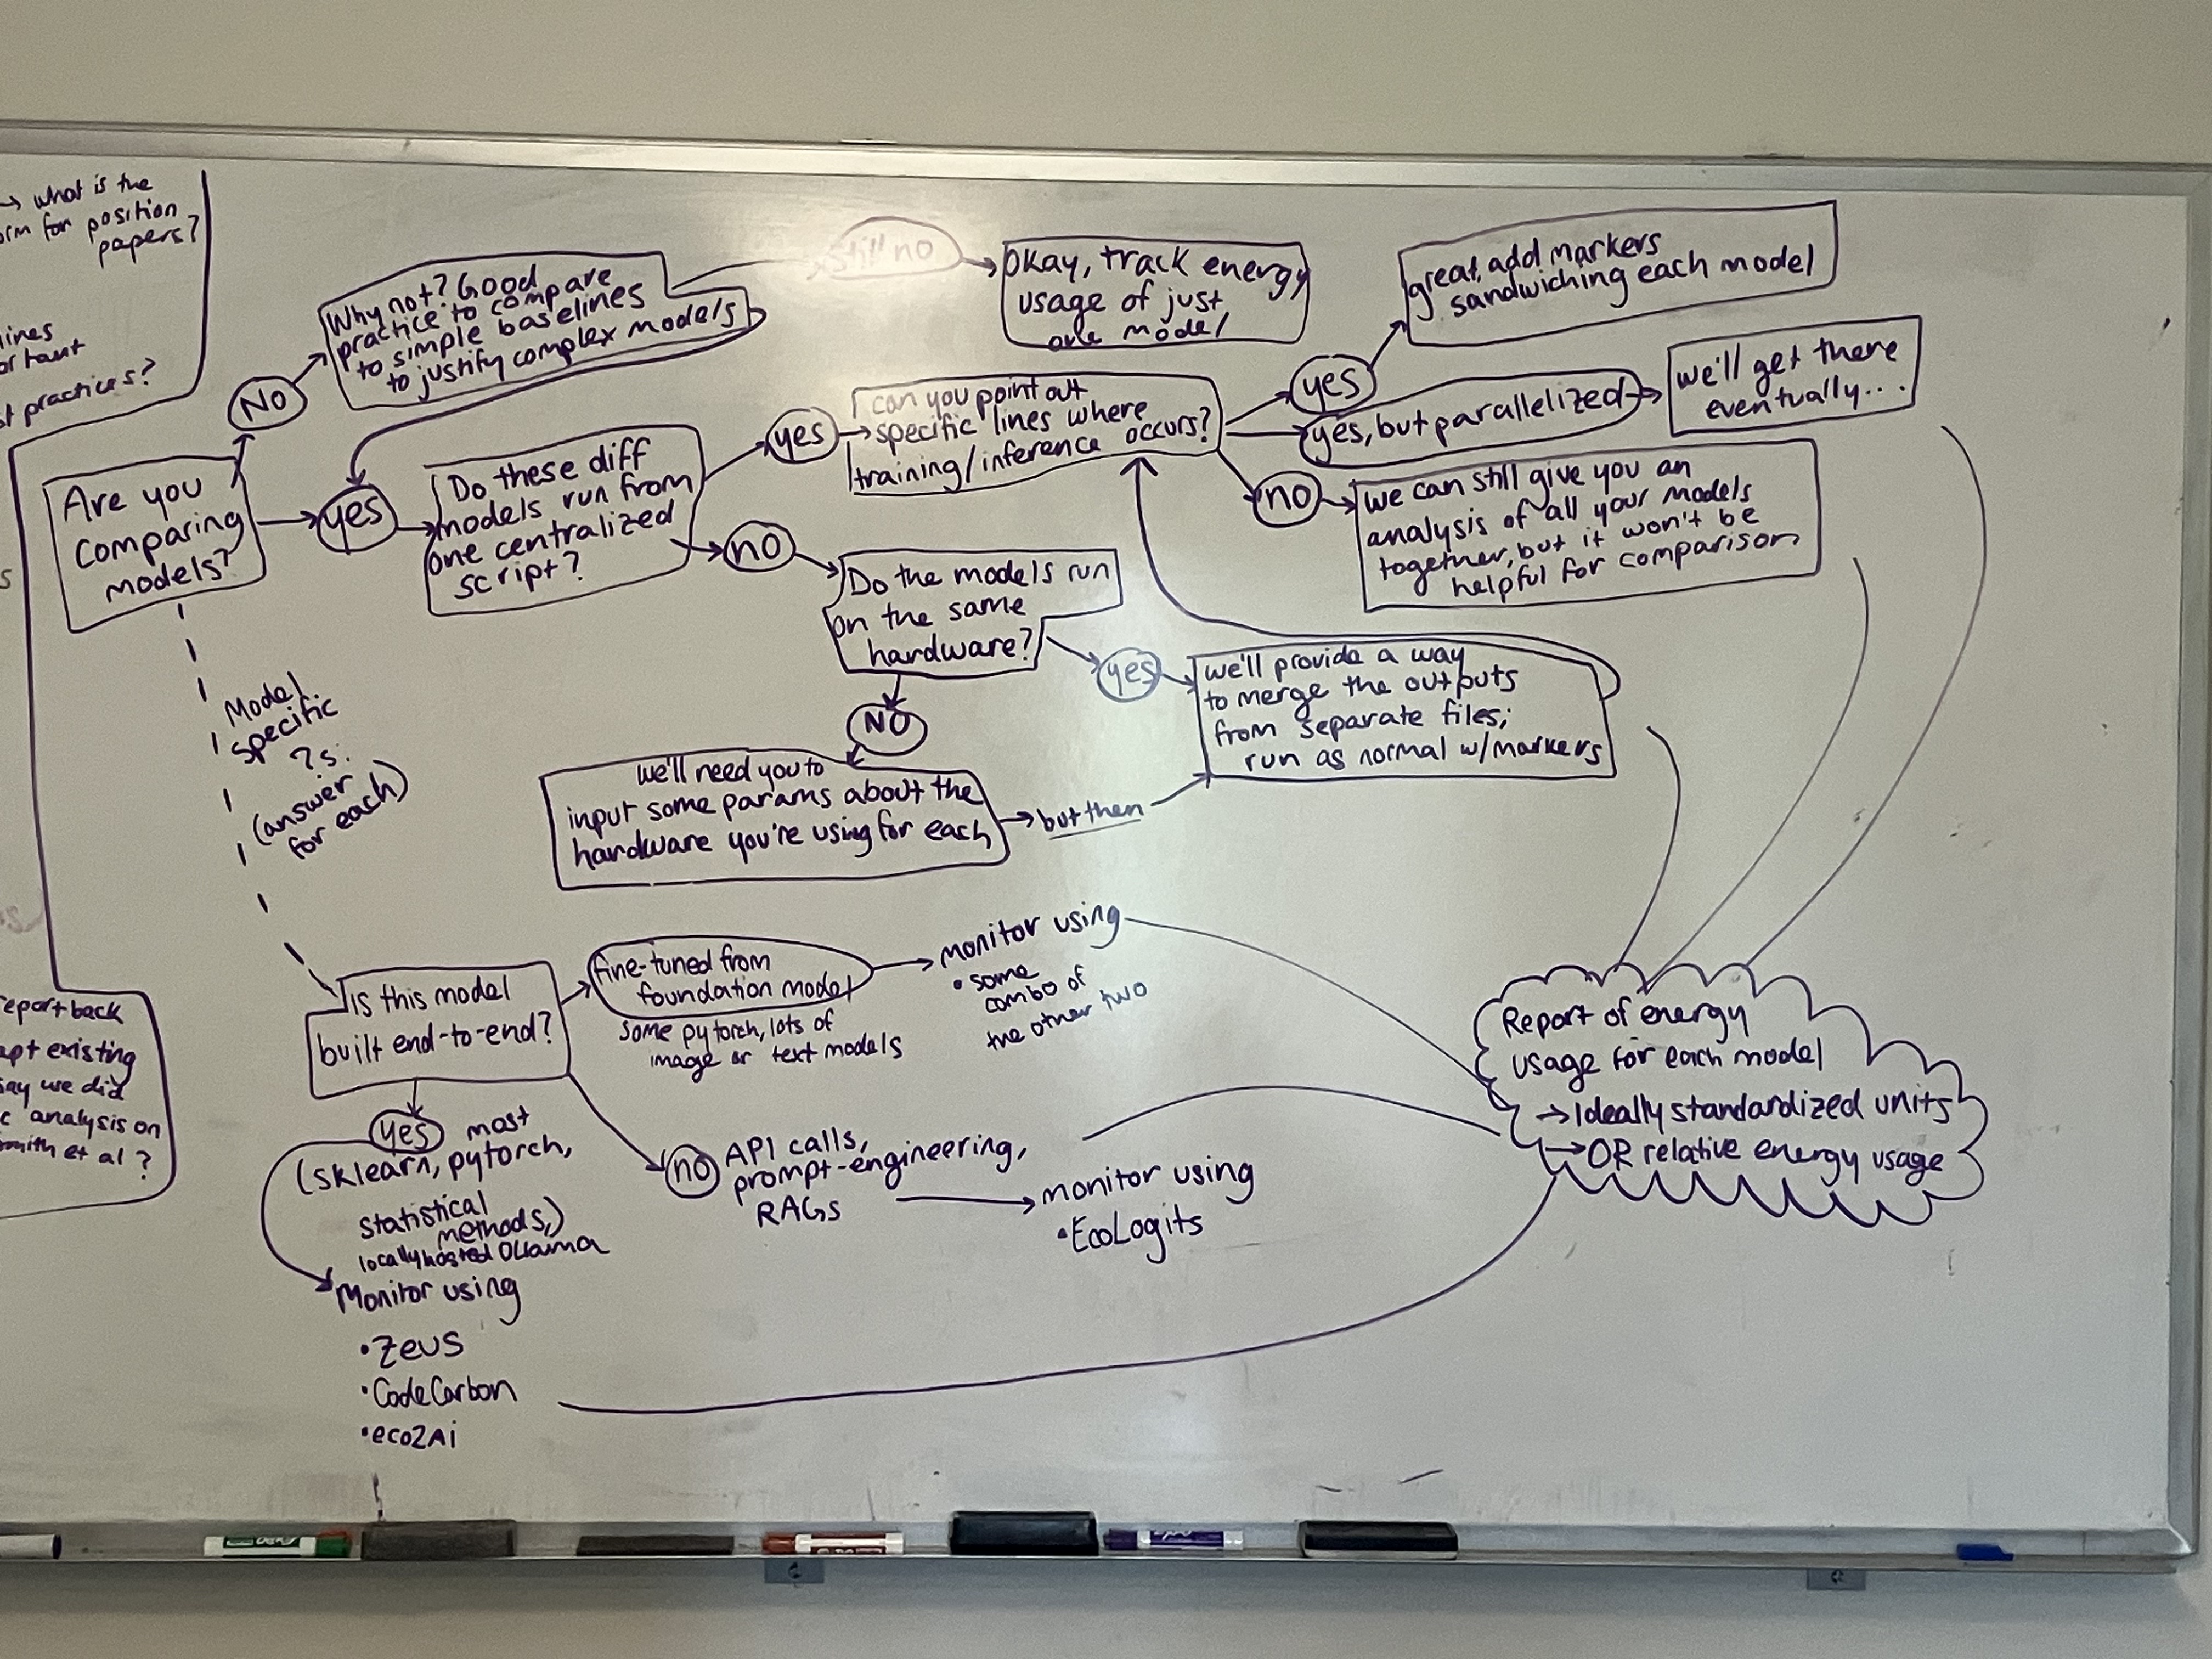
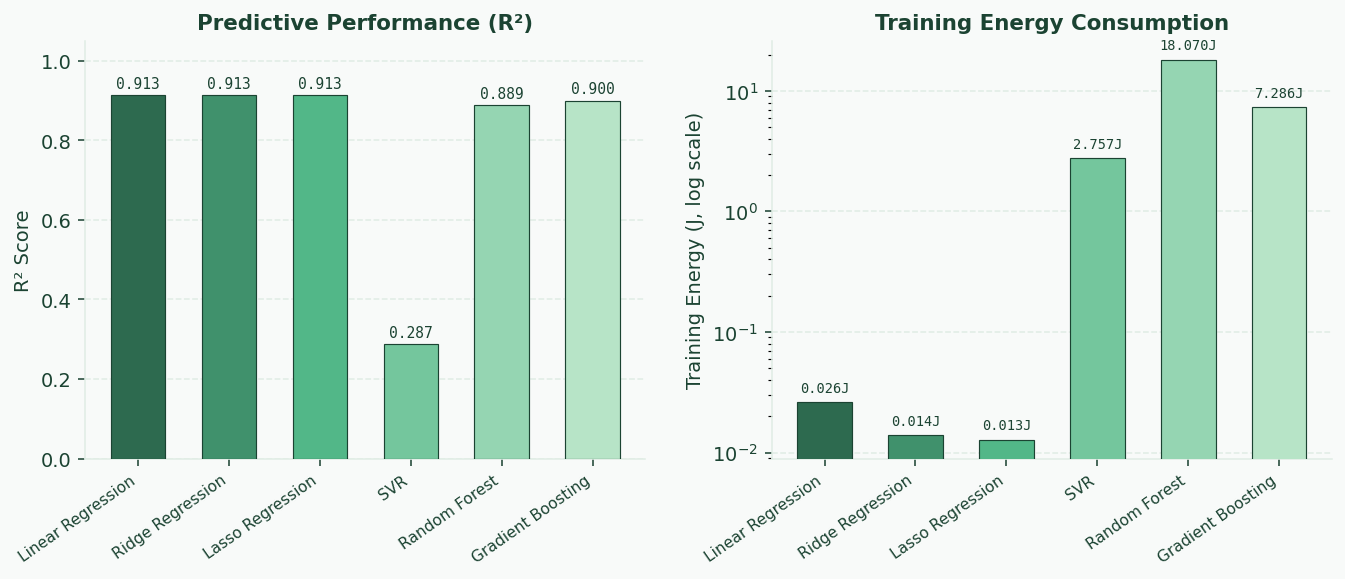
Energy Consumption Calculator Tool
What’s next? 📣
Short term:
- We've started with a small sample size for proof of concept in our literature review, but plan to assess all articles published in the EDS journal.
- We've currently limited our review in scope to the Environmental Data Science journal, but since we've built this agentic repository workflow it is a scalable approach for assessment of other journals as well.
- We will continue development work on the energy consumption analysis tool.
Long term:
- We plan to submit this for the September 4th submission deadline for the Environmental Data Science Journal.
Who should see this next?
- We would love for this to be a tool that many researchers can use in their work and alongside other performance metrics to assess analytical tools holistically!
Cite & Reuse
If you use these materials, please cite:
Summit Team. (2026). Summit_group_2026_1 — Innovation Summit 2026. https://github.com/CU-ESIIL/Summit_group_2026_1
License: CC-BY-4.0 unless noted.