How to use this page during the Summit
-
This page is your team’s shared workspace and final report-out page. It captures your group’s process and thinking throughout the Summit and will be used to share your work with others.
-
Use this page as your team’s working record during the Summit and your final report-out.
-
The Summit has several different goals and thus you will use the page differently each day: Day 1 is for alignment, Day 2 is for building one useful thing, and Day 3 is for synthesis and report- out.
-
Look for the green buttons to indicate what you need to edit.
-
Megaphones 📣 indicate which items you will be presenting during the end-of-day report-outs.
-
Only the items with megaphones will be visible when you hit the 'Summit Report Out' button.
-
If you turn off 'Instructions' then you will only see the page content for public display.
TwinFlames
Use the power of embedding and digital twin to identify probable burn area if we detect an ignition location near real time.
How to replace the image above
Upload an image that represents your project and welcome people to your page.
Upload your own image to assets/hero/ and replace the file named hero.png. Use a wide image if you can, then refresh the site preview to check how it looks.
Keep the file path assets/hero/hero.png if you want the Markdown above to keep working.
People
Day 1 task
Get to know your team: share your cards (5-7 mins). Update your team roster (2-3 min).
Use the in-person name cards to guide quick introductions.
| Name card prompts | Follow-up notes |
|---|---|
 |
 |
| Name | Affiliation | Contact | Github |
|---|---|---|---|
| Danish Kumar | University of Maryland | dkumar18@umd.edu | dkumar18-umd |
| Nayani Ilangakoon | CIRES | ginikanda.ilangakoon@colorado.edu | chathu84 |
| Yuying Ren | University of Colorado Boulder | yuying.ren@colorado.edu | YuyingRenCU |
| Asha Paudel | NextEra Energy | paudelasha@gmail.com | paudelasha |
Team Norms and Decision Making
Day 1 task
Our team norms:
- Turn taking
- Transparent on AI use
- Dot voting (2 votes each)
- Gradients of agreement
Our decision making strategy:
We will use gradient-of-agreement checks for major choices and or move to voting if we hit any bottlenecks
[Edit content below here in Markdown](https://github.com/CU-ESIIL/Summit_group_2026_11/edit/main/docs/index.md?plain=1#L106){ .md-button target="_blank" rel="noopener" }
Short term:
- Create workflow for integrating earth embedding to inform digital twin for fire detection and impact area estimates
Long term:
-Interactive maps with spatial layers on risk, previous burned and potential impacted areas and model outputs
-Digital twin scenario explorer with weather data and impact area estimates for particular location
-Dashboard to monitor key metrics and trends over time
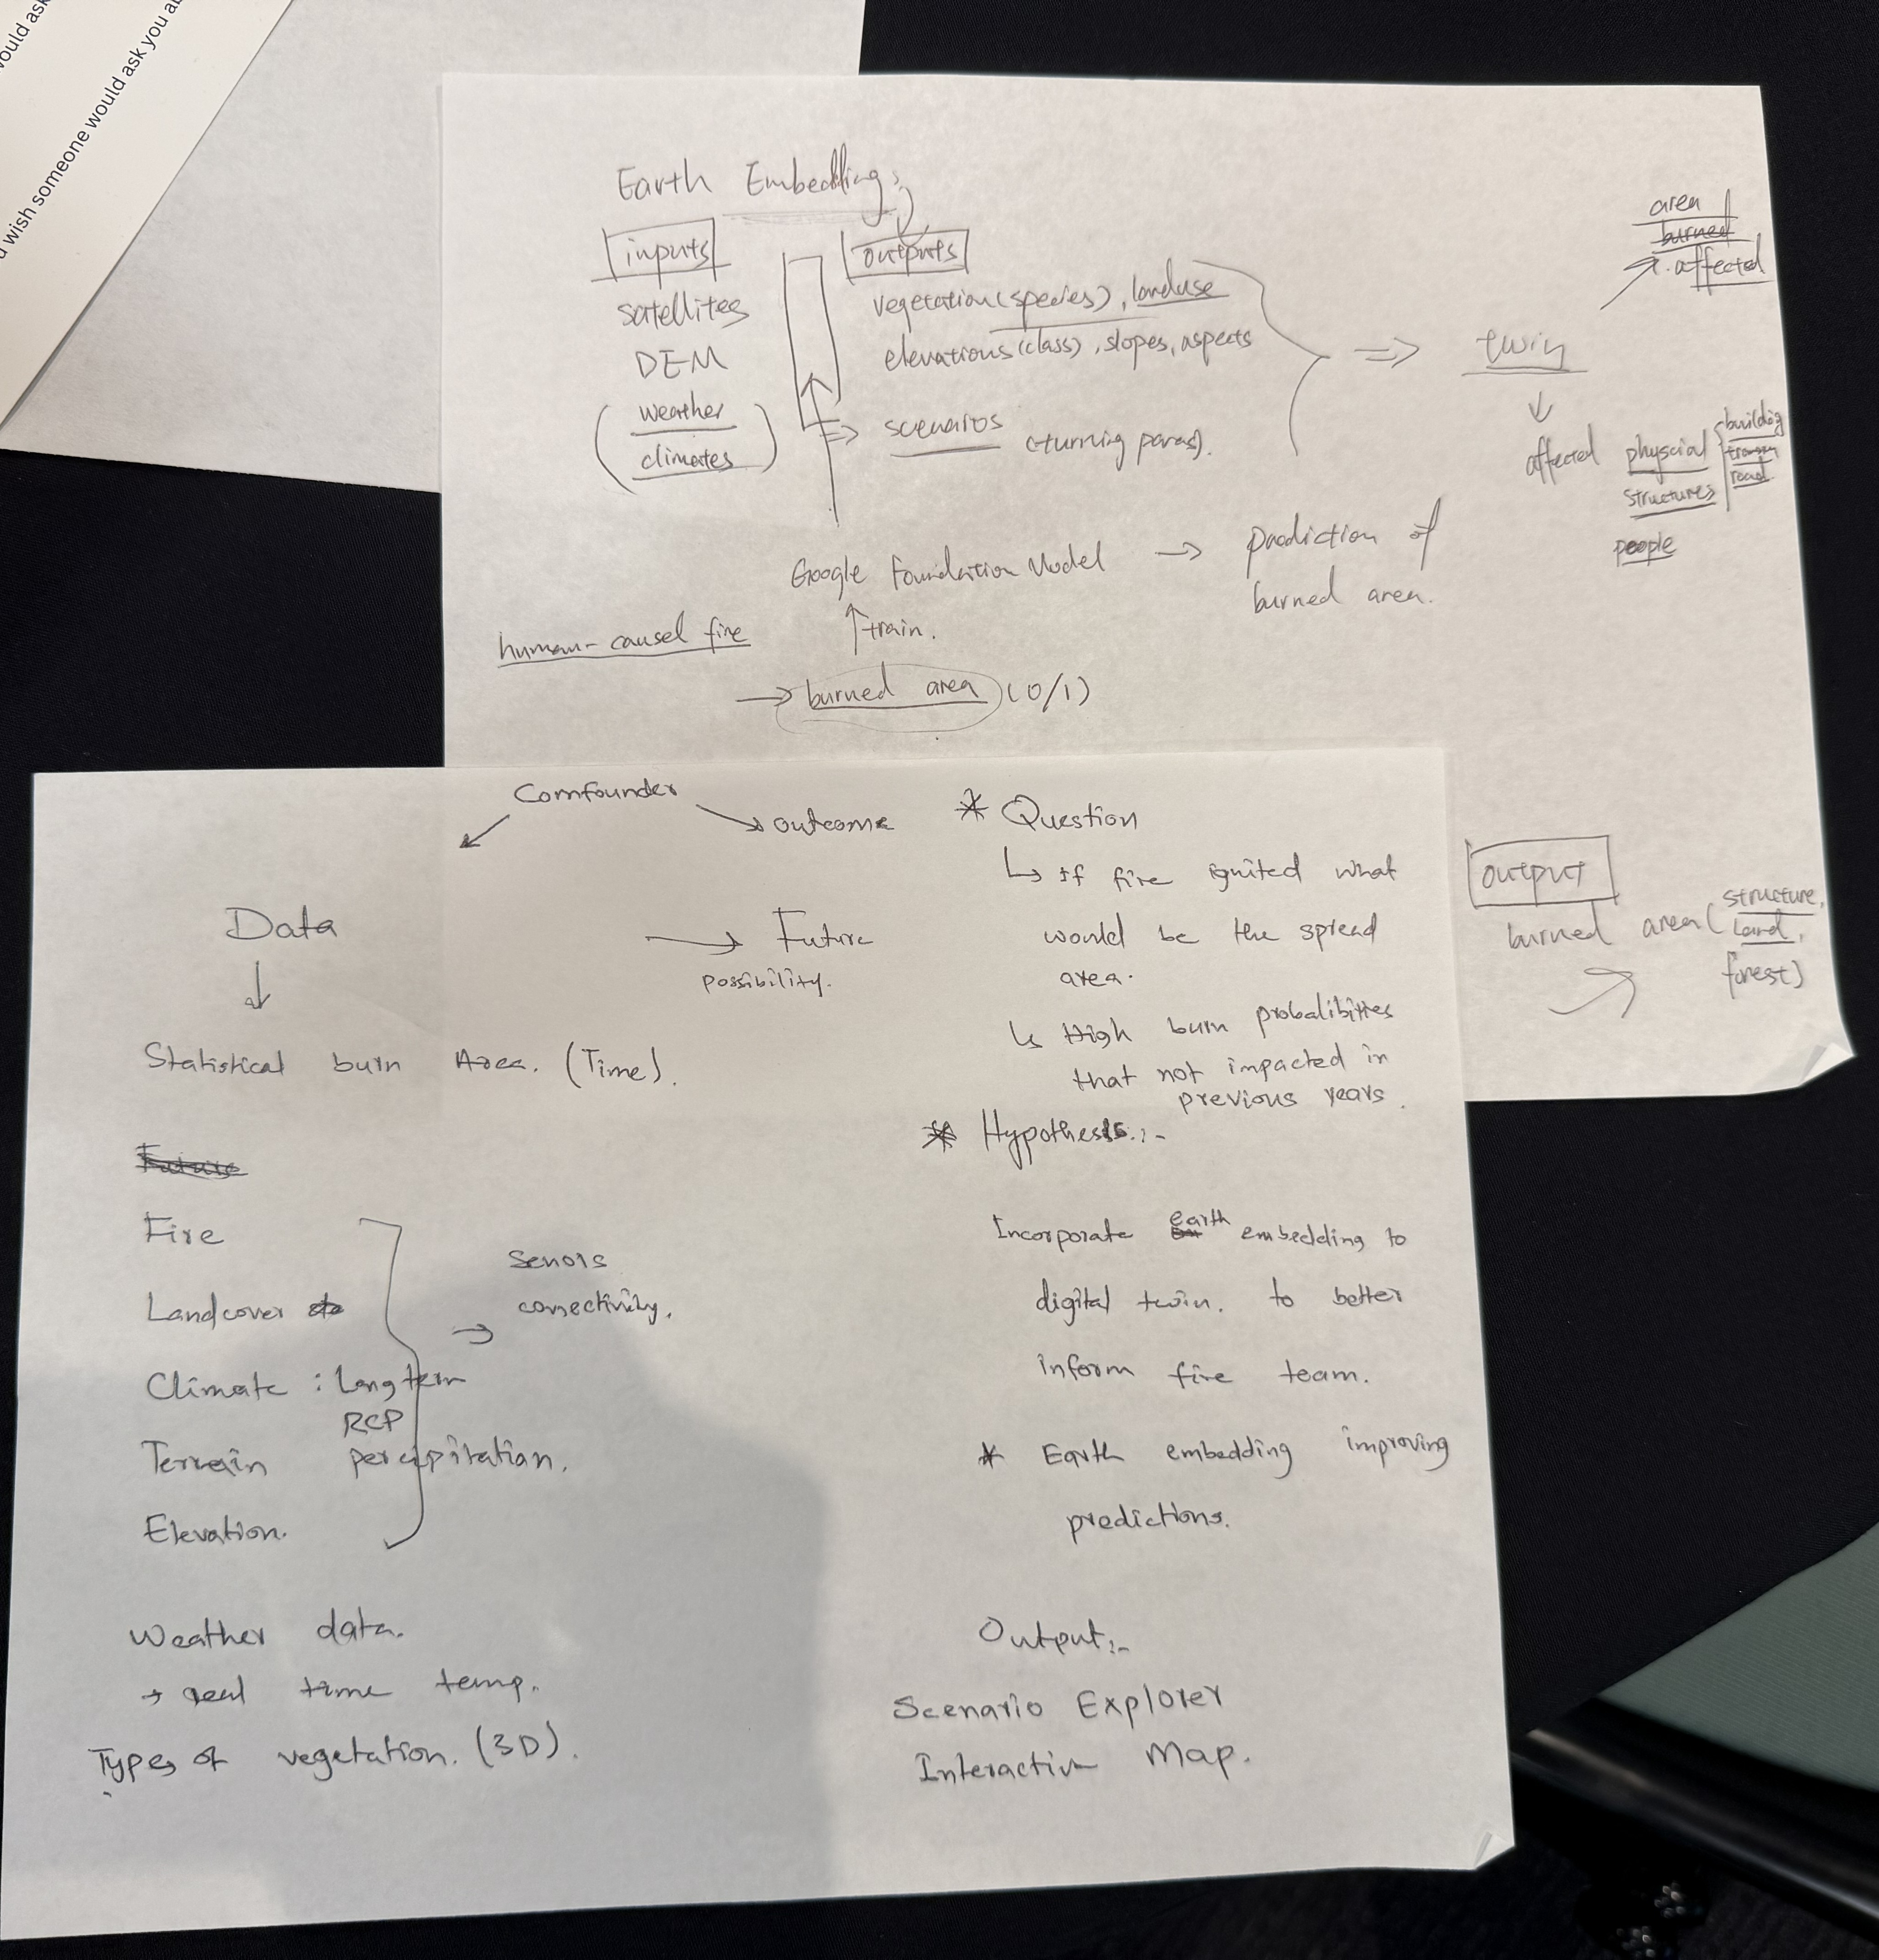
Morning whiteboard or notes showing the question, hypotheses, and context we used to start Day 2.
Our question(s) 📣
Our working question:
-What is the probable affected area if ignited?
Use the power of embedding and digital twin to identify probable burn area if we detect an ignition location near real time.
What would count as progress:
-Create a reproducable workflow incorporating earth embeddings to inform digital twin
-Earth embeddings for potential impacted areas/footprints
Workflow Image
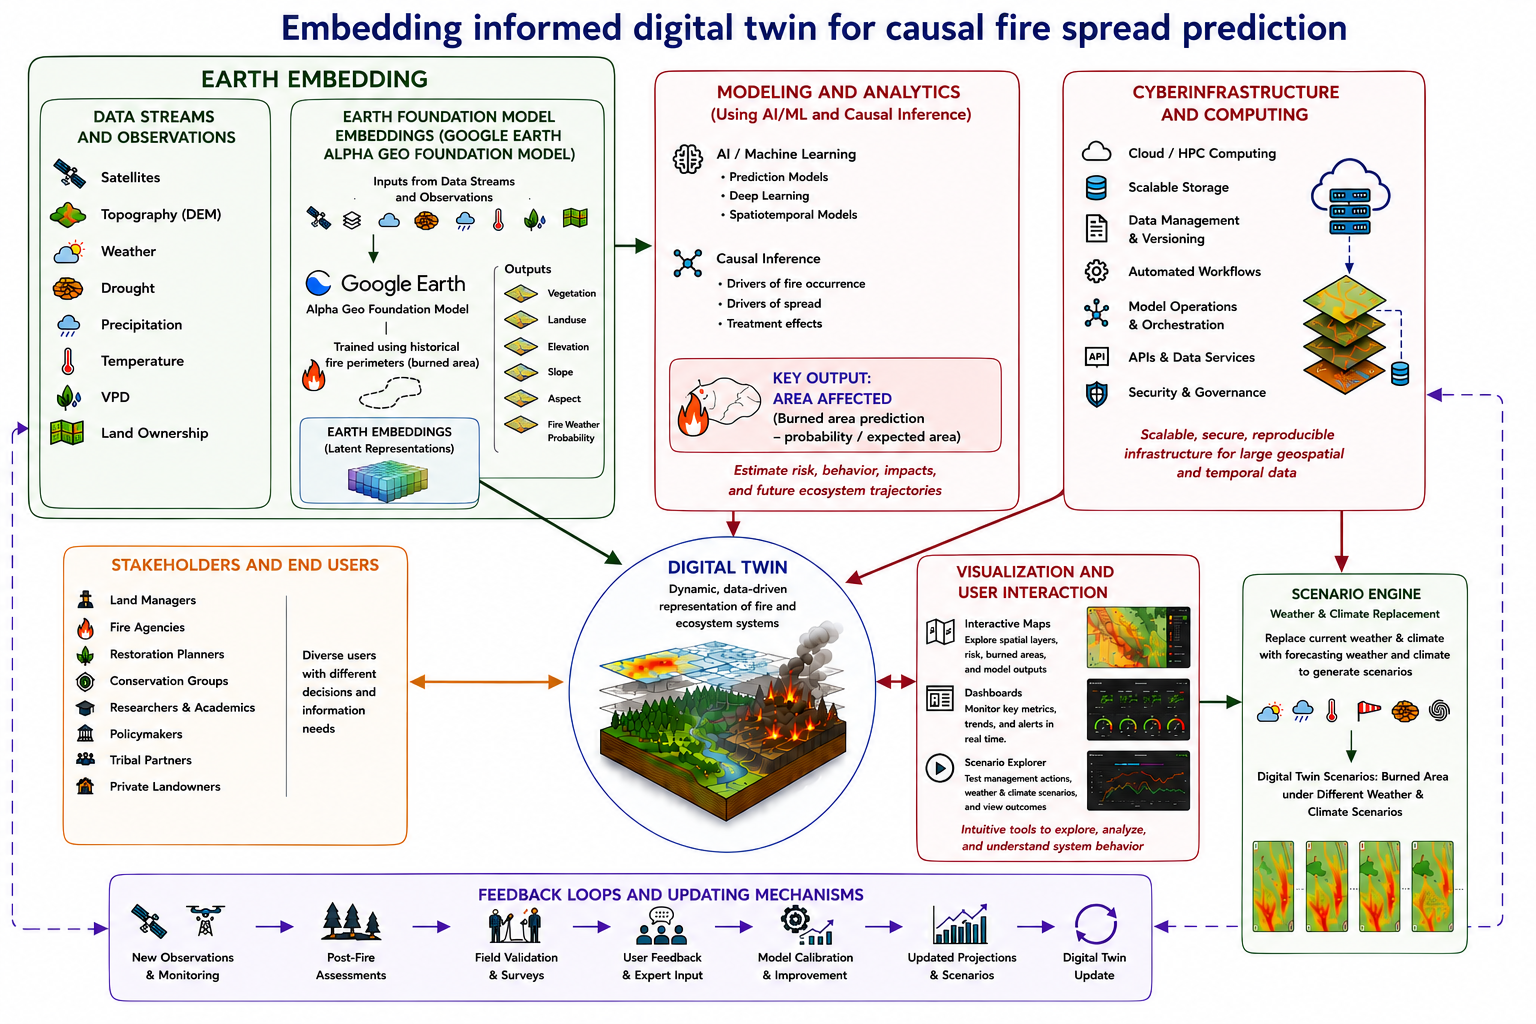
Hypotheses/Intentions [Optional: probably not relevant if you are creating an educational tool]
- Use the power of causal inference and earth embedding can improve prediction/estimation of fire impacted areas if ignition happens and help inform decision making.
- The idea is to input fire ignition locations as soon as we detected one (may be from GOES-R satellite data for real-time fire detection) to the digital twin
- Retrieve weather data closest that time
- Retrive embedding data from 5 day-sentinel-2 or any closeset data to the time of ignition detection
- then run the model and provide best estimate of probable burn area so that managment teams can act before the fire reach.
Why this matters (the “upshot”) 📣
This matters because: Wildfires threaten human life, damages infrastructure and impact livelihoods and local economies. As climate changes, early prediction and limiting its impact can save lives and reduce its impact on economy. Our project leverages earth observation embeddings to build fire spread models that are more accurate and computationally efficient than conventional approaches, then delivers those results through interactive digital twins that translate complex science into clear, actionable intelligence.
People who could use this: Local governments, fire fightings teams, forest services
...
Data sources we’re exploring 📣
-GEE fire database for colorado for 2020
-Earth Embeddings data from google AlphaEarth Foundation
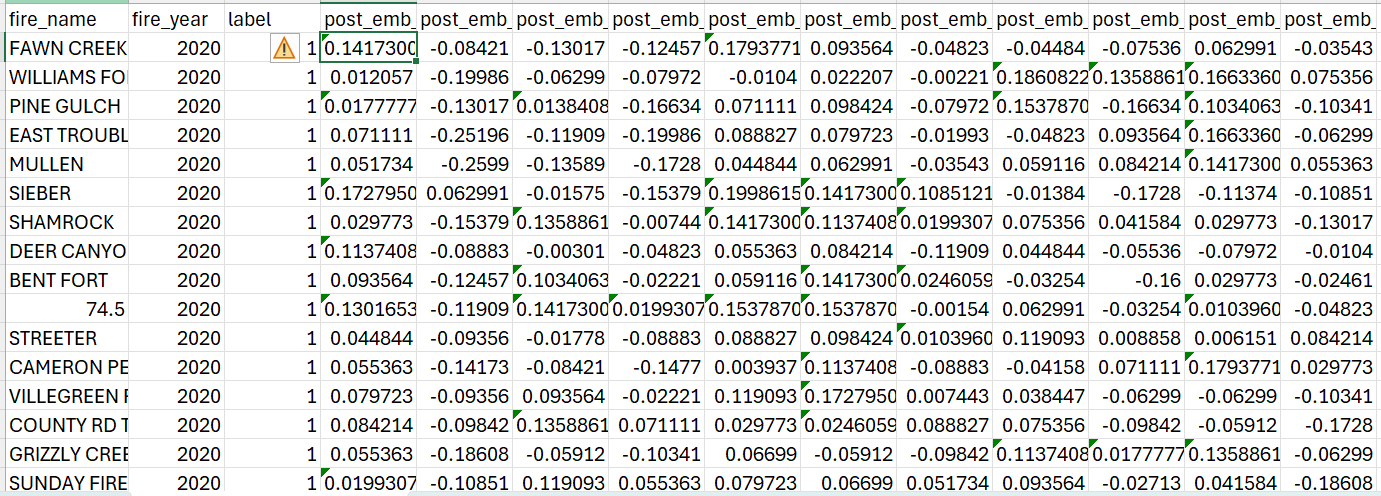
Snapshot showing initial data patterns.
Promising data sources:
- Data source 1: GridMet climate data
- Data source 2: SRTM based elevation, slope, and aspect
- Data source 3: MTBS fire perimeter and area polygons
- Data source 4: ...
Methods/technologies we’re testing 📣
methods
Add 2-4 methods/technologies we're testing (stats, models, viz).
Methods/technologies we are testing:
| Method or technology | What we tested | Early note |
|---|---|---|
| Random Forest | Prediction of burn/no-burn and probable affected area | Initial test/no tuning of parameters yet |
| ... | ... | ... |
| ... | ... | ... |
| ... | ... | ... |
Challenges identified
- currently we use average emmbedding values per band per fire location and did not investigate the full range of capability of values in raster format
- ...
Next Steps
Short term: Fine tune the model and also include the cause of fire which we seems has an impact on burned and non-buned areas if we used only embedding and climate
Long term: Buld the UI to predict the potential affected area based on user inputs
Day 3 Tasks
Sythesis: highlight 2-3 visuals that tell the story; keep text crisp. Practice a 6-minute walkthrough of the homepage. Why -> Questions -> Data/Methods -> Findings -> Next
Team Photo
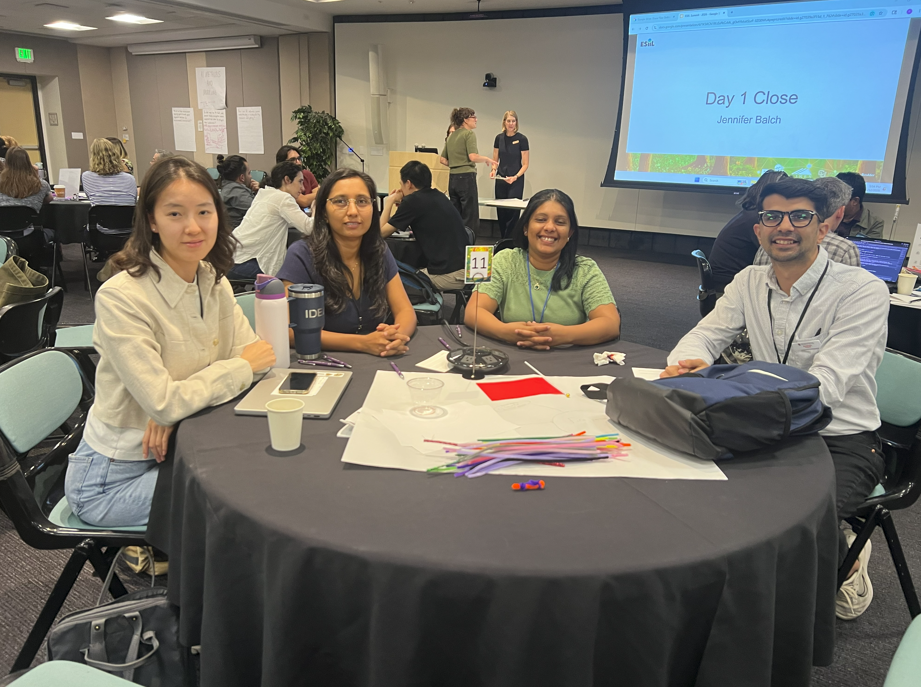
Team members and collaborators who contributed to this project.
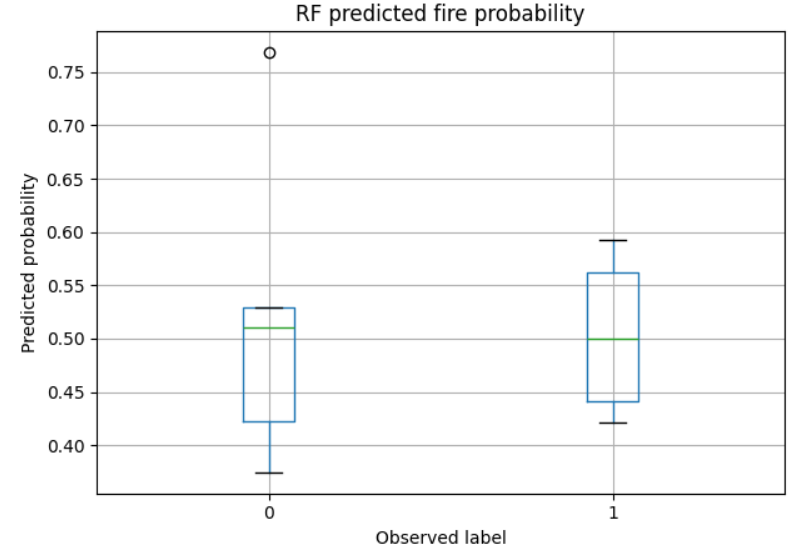
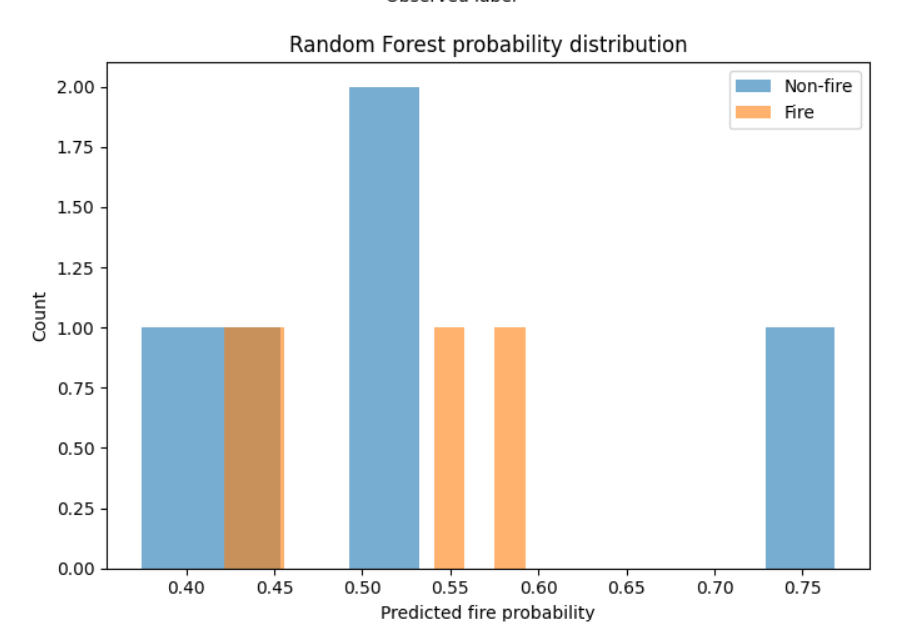
Findings at a glance 📣
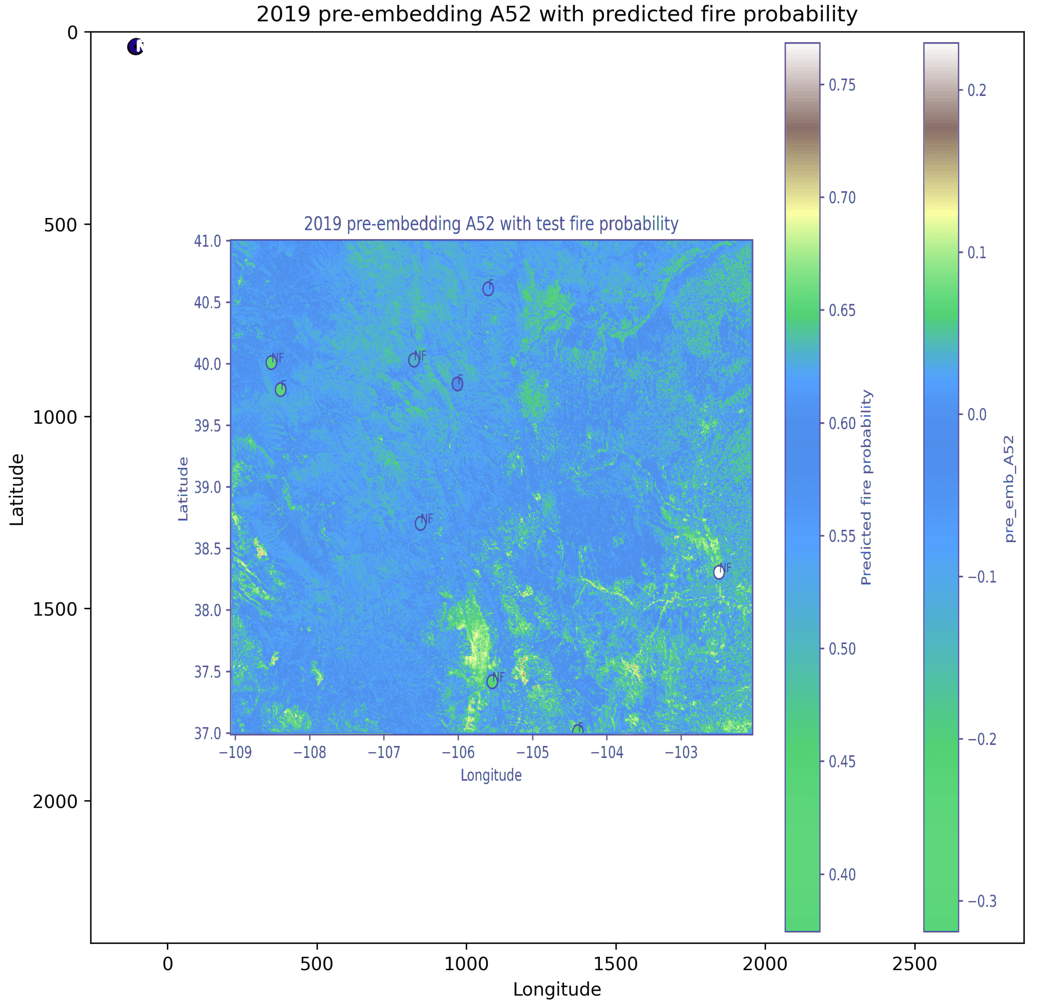
Headline 1 — Burn probability of testing data and their distribution
Headline 2 — Random forest importance of parameters in getting burn probability
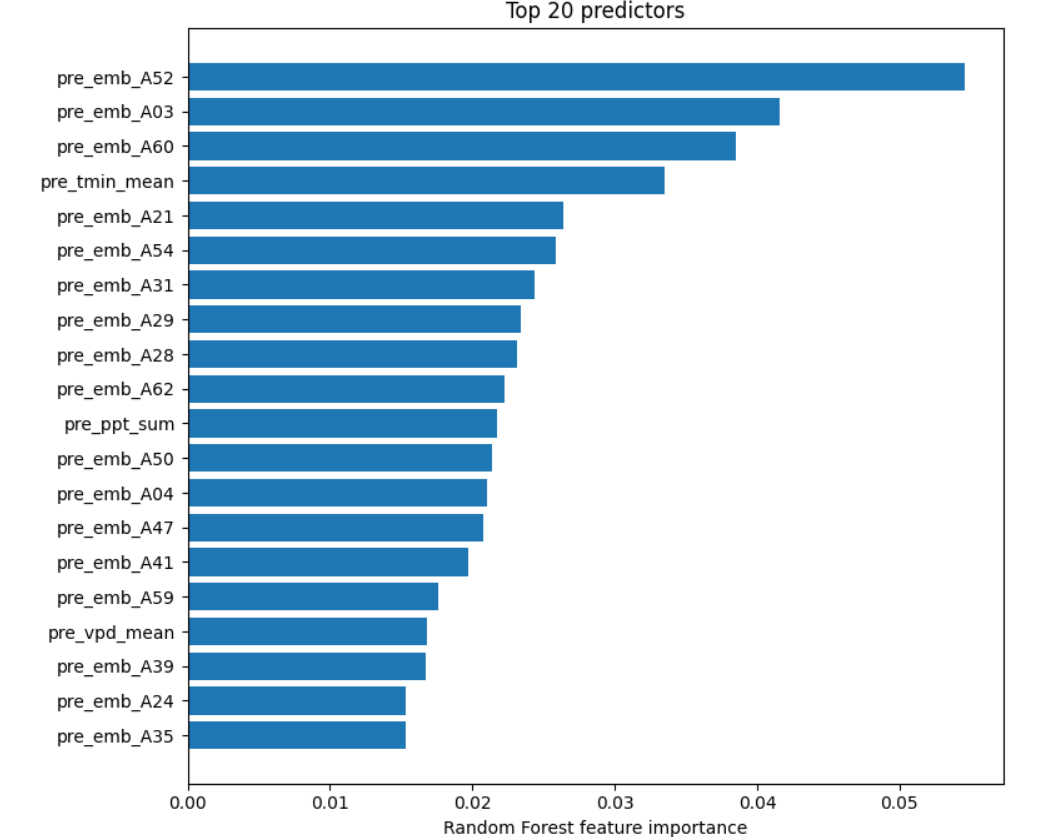
...
Headline 3 — Burn probability of our test locations
 ...
...
Visuals that tell a story 📣
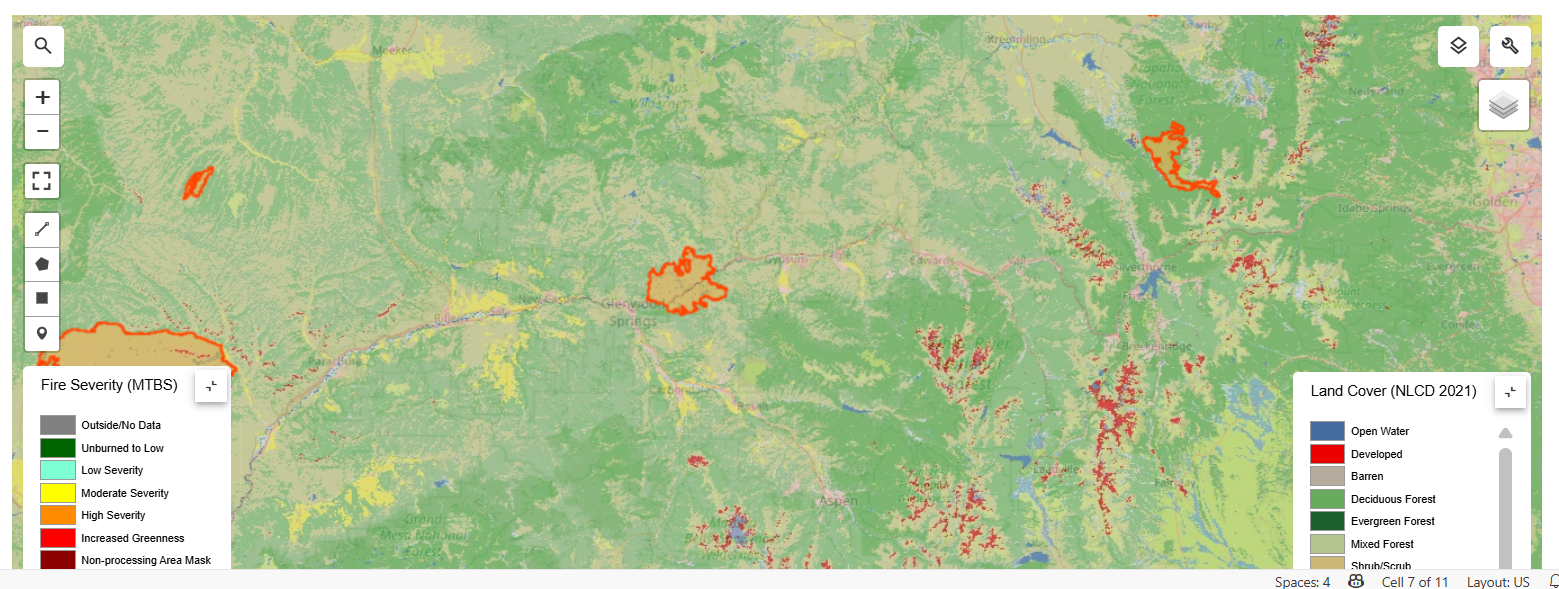
Visual 1: the main pattern or output we want people to remember.
What’s next? 📣
Short term:
- ...
Long term:
- ...
Who should see this next
- ...
Cite & Reuse
If you use these materials, please cite:
Summit Team. (2026). Summit Group 2026 Team 11 — Innovation Summit 2026. https://github.com/CU-ESIIL/Summit_group_2026_11
License: CC-BY-4.0 unless noted.