Team name: Lucky 13
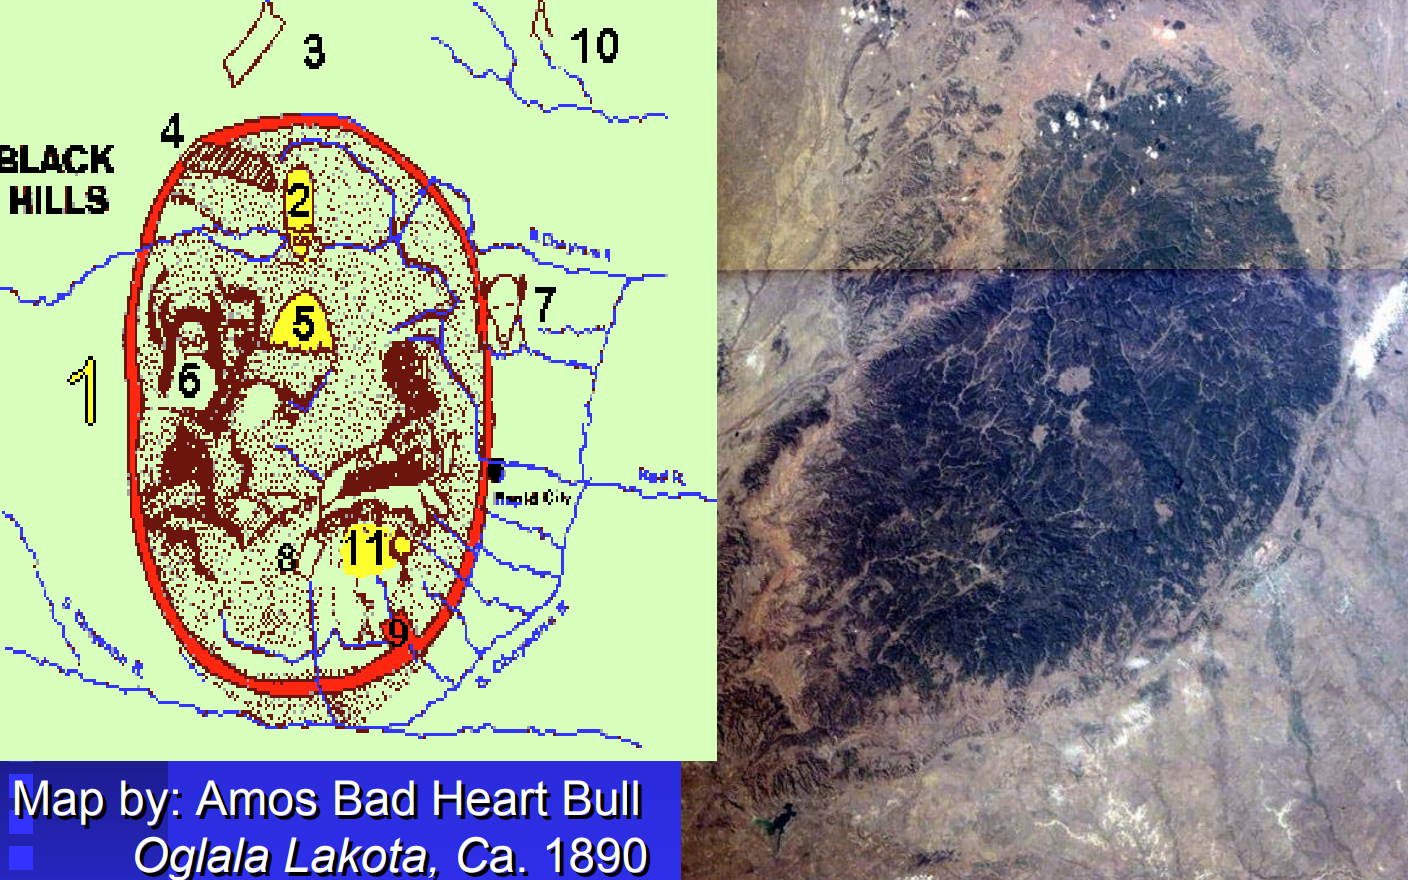
Predicting Water Impacts from Current and Future Mining in the Black Hills, SD
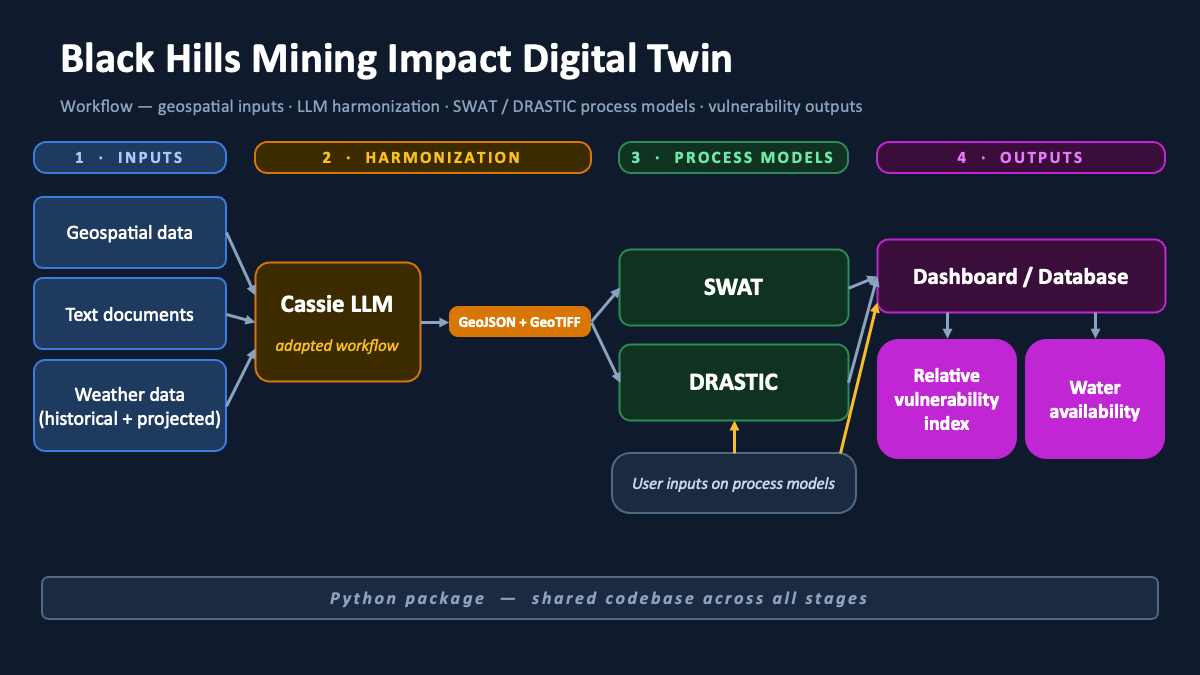
(w/ a Digital Twin framework)
Team (lucky) 13:
People
| Name | Affiliation | Contact | Github |
|---|---|---|---|
| Naupaka Zimmerman | University of Kansas | naupaka@gmail.com | naupaka |
| Lala Kounta | Michigan State University | kountalala@msu.edu | lkounta |
| Lilly Jones | CIRES Earth Lab, CU Boulder | lijo8146@colorado.edu | daearconsulting |
| Joni Tobacco | Salish Kootenai College | jktobacco@gmail.com | jonit12324 |
| Elisha Yellow Thunder | Oglala Lakota College/SDSU | eyellowthunder@olc.edu | wakinyanzi |
| C. Jason Tinant | Oglala Lakota College | jtinant@olc.edu | cjtinant |
| Chong Seok Choi | Cornell University | cc3226@cornell.edu | chongseokchoi |
| Sankung Fatty | -- | fattysankung9@gmail.com | -- |
| Al Kaushkis | -- | akuslikis@gmail.com | -- |
| Max Cook | Colorado State University | maxwell.cook@colostate.edu | maxwellCcook |
| Erica Laundreaux | -- | erica.lx32@gmail.com | -- |
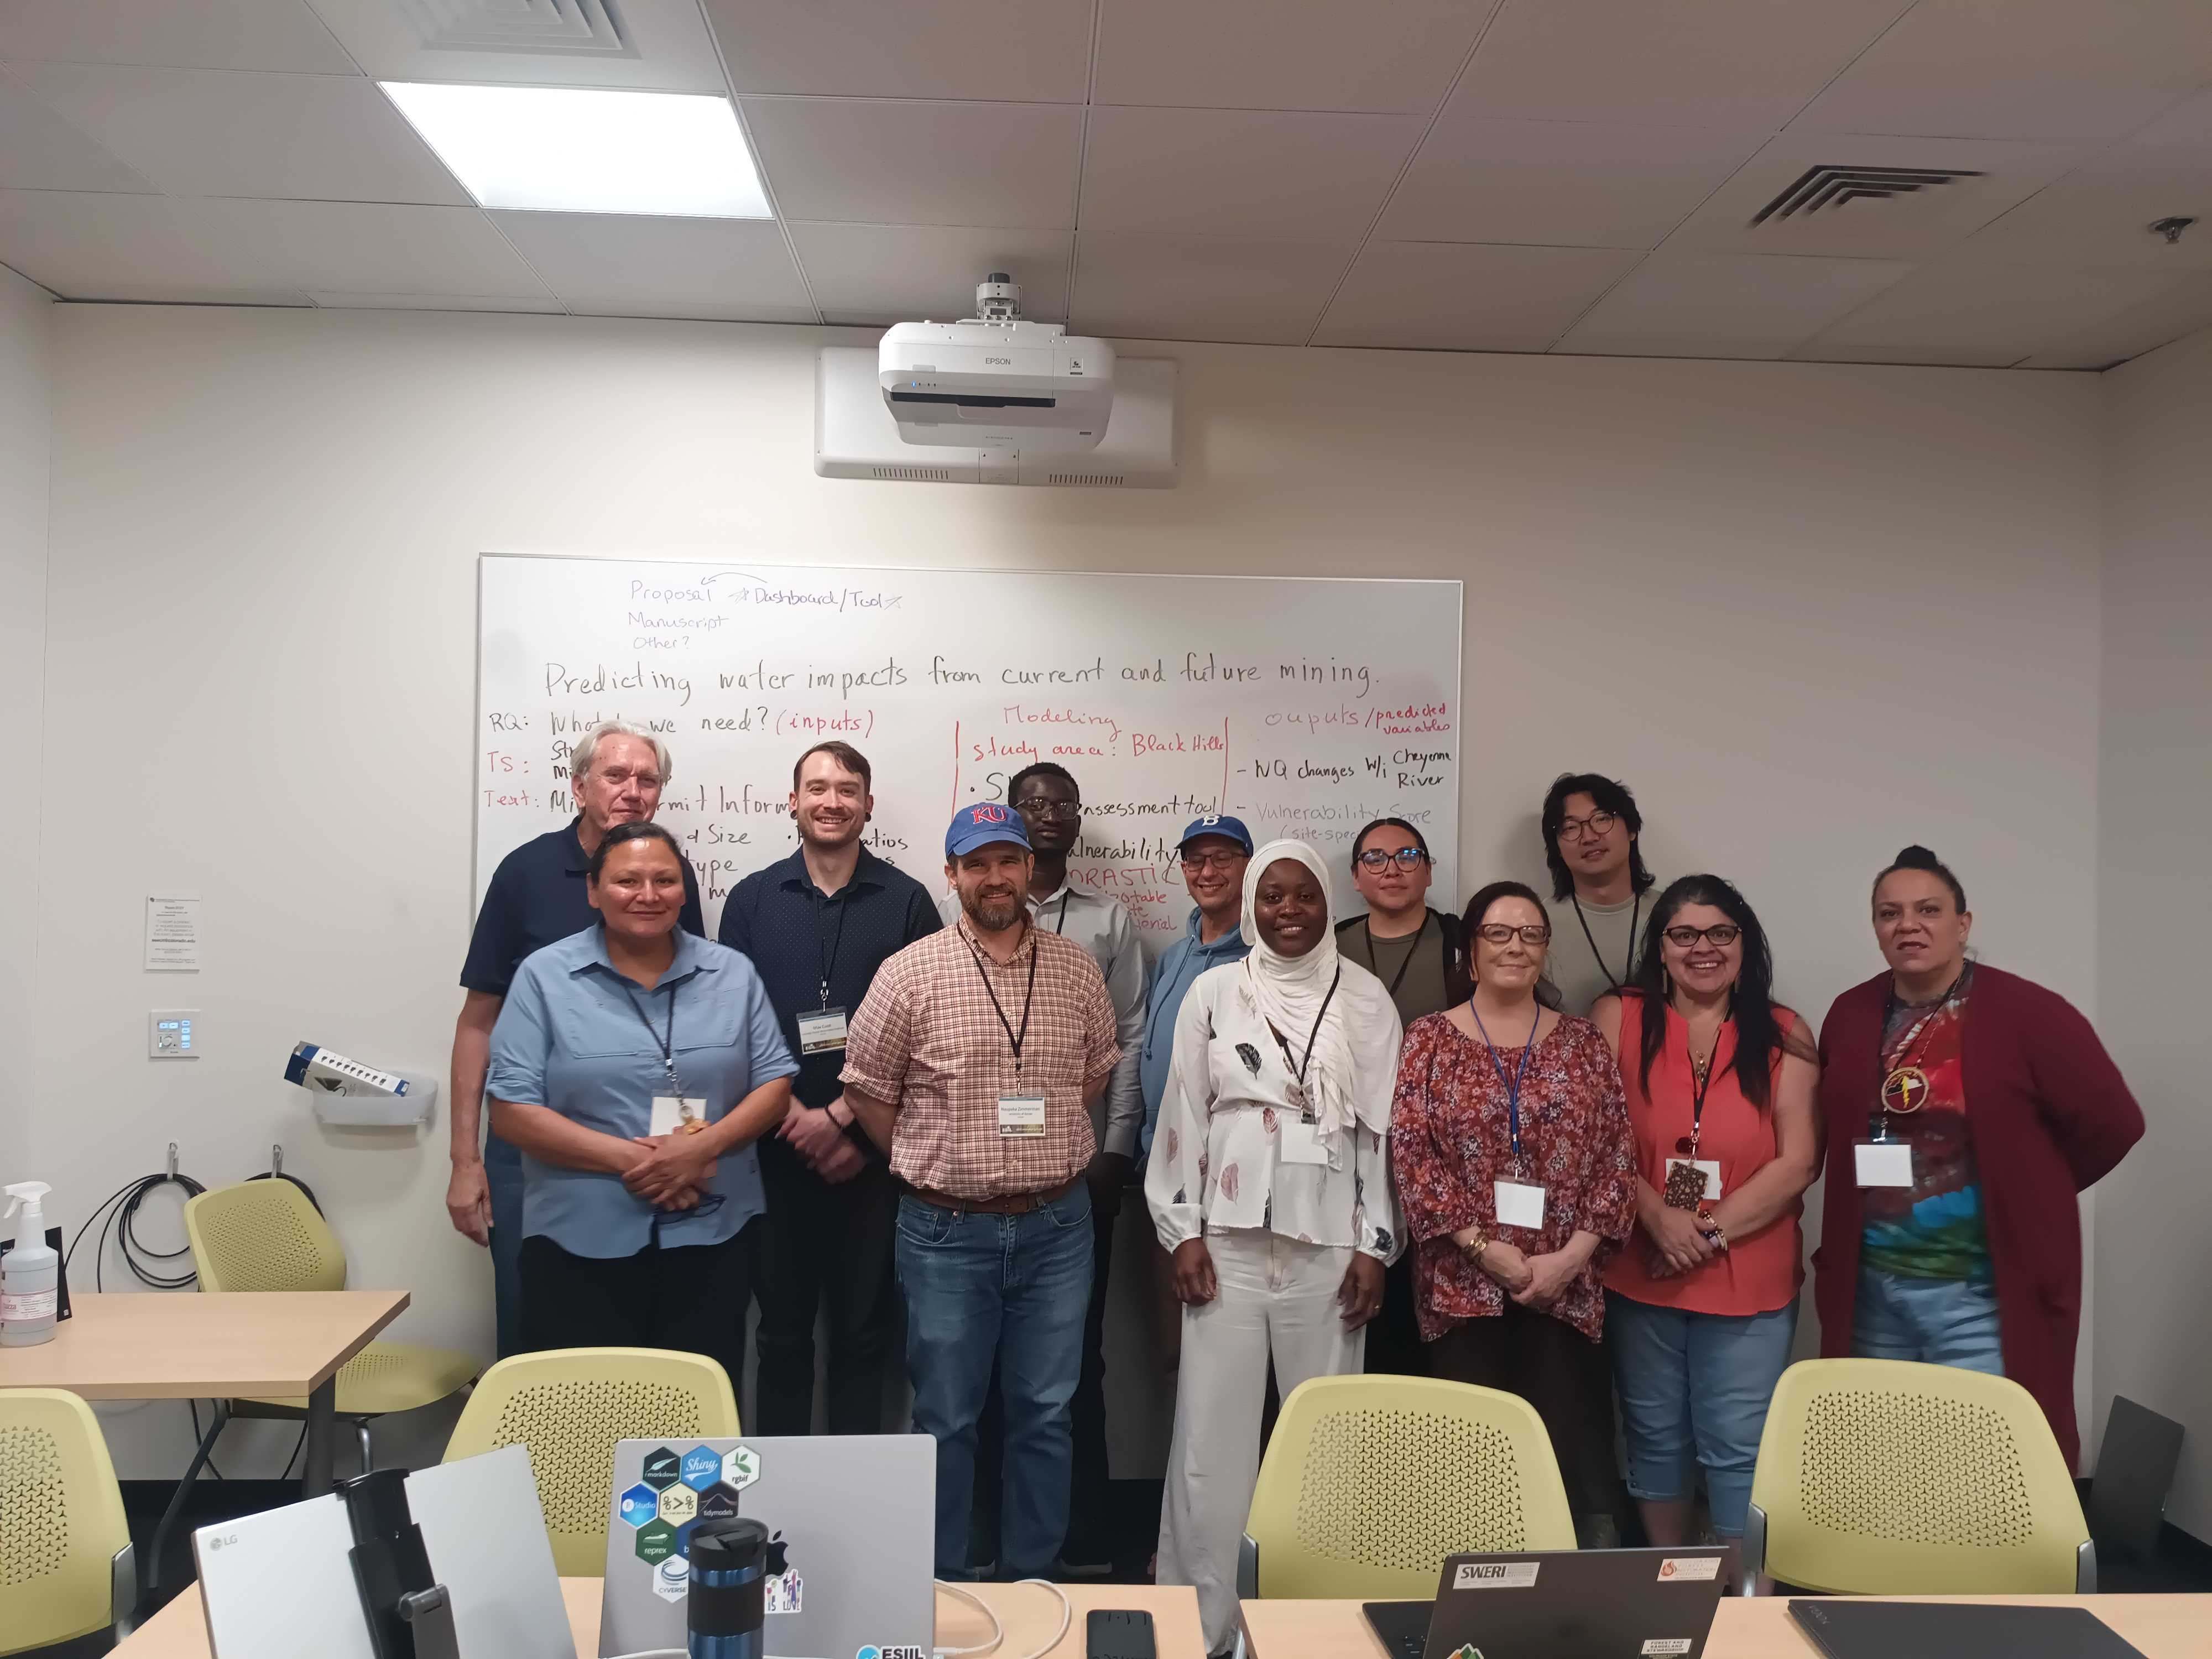
Team Photo
Team Norms and Decision Making
Our team norms:
- Define everything:
- Goals:
- To predict water impacts from current and future mining in the Black Hills, SD.
- Raise awareness on Tribal issues of mining impacts.
-
Grow and share our data science knowledge.
-
transparency and processes
- Include only open data
-
Centralize in repository
-
How we will keep a team log
- How we protect others intellectual property
- What is our AI authorship agreement
- What are our Possible pitfalls
- What is our decision making strategy:
...
Our product(s) 📣
Short term:
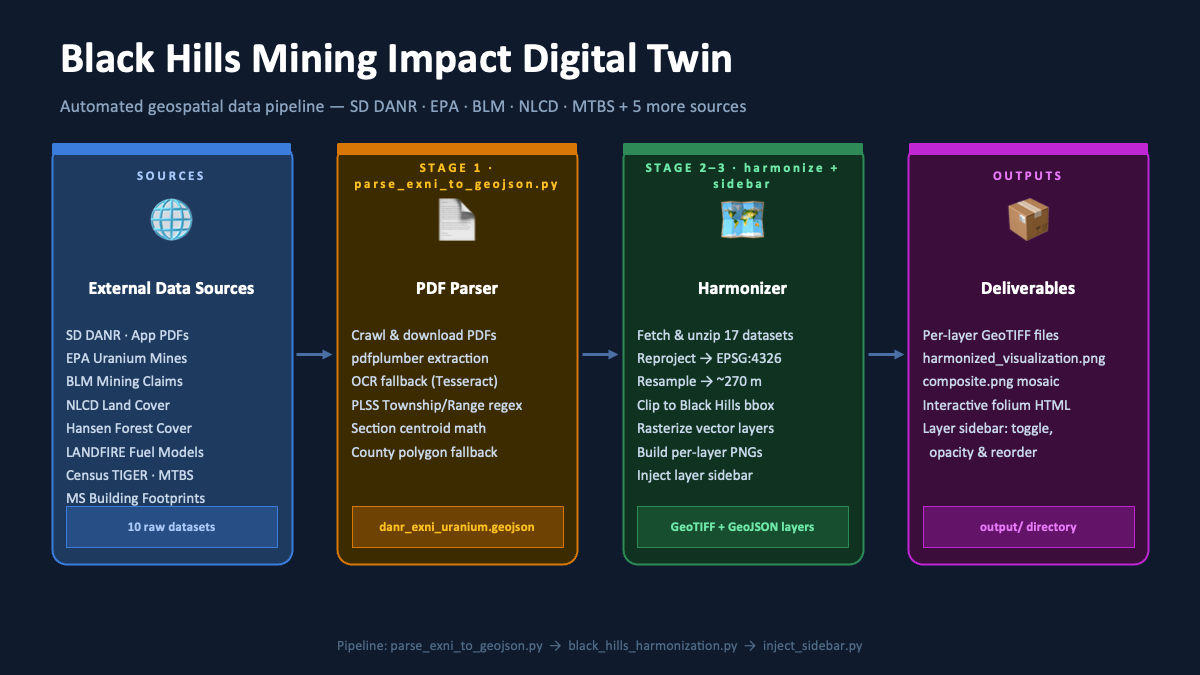
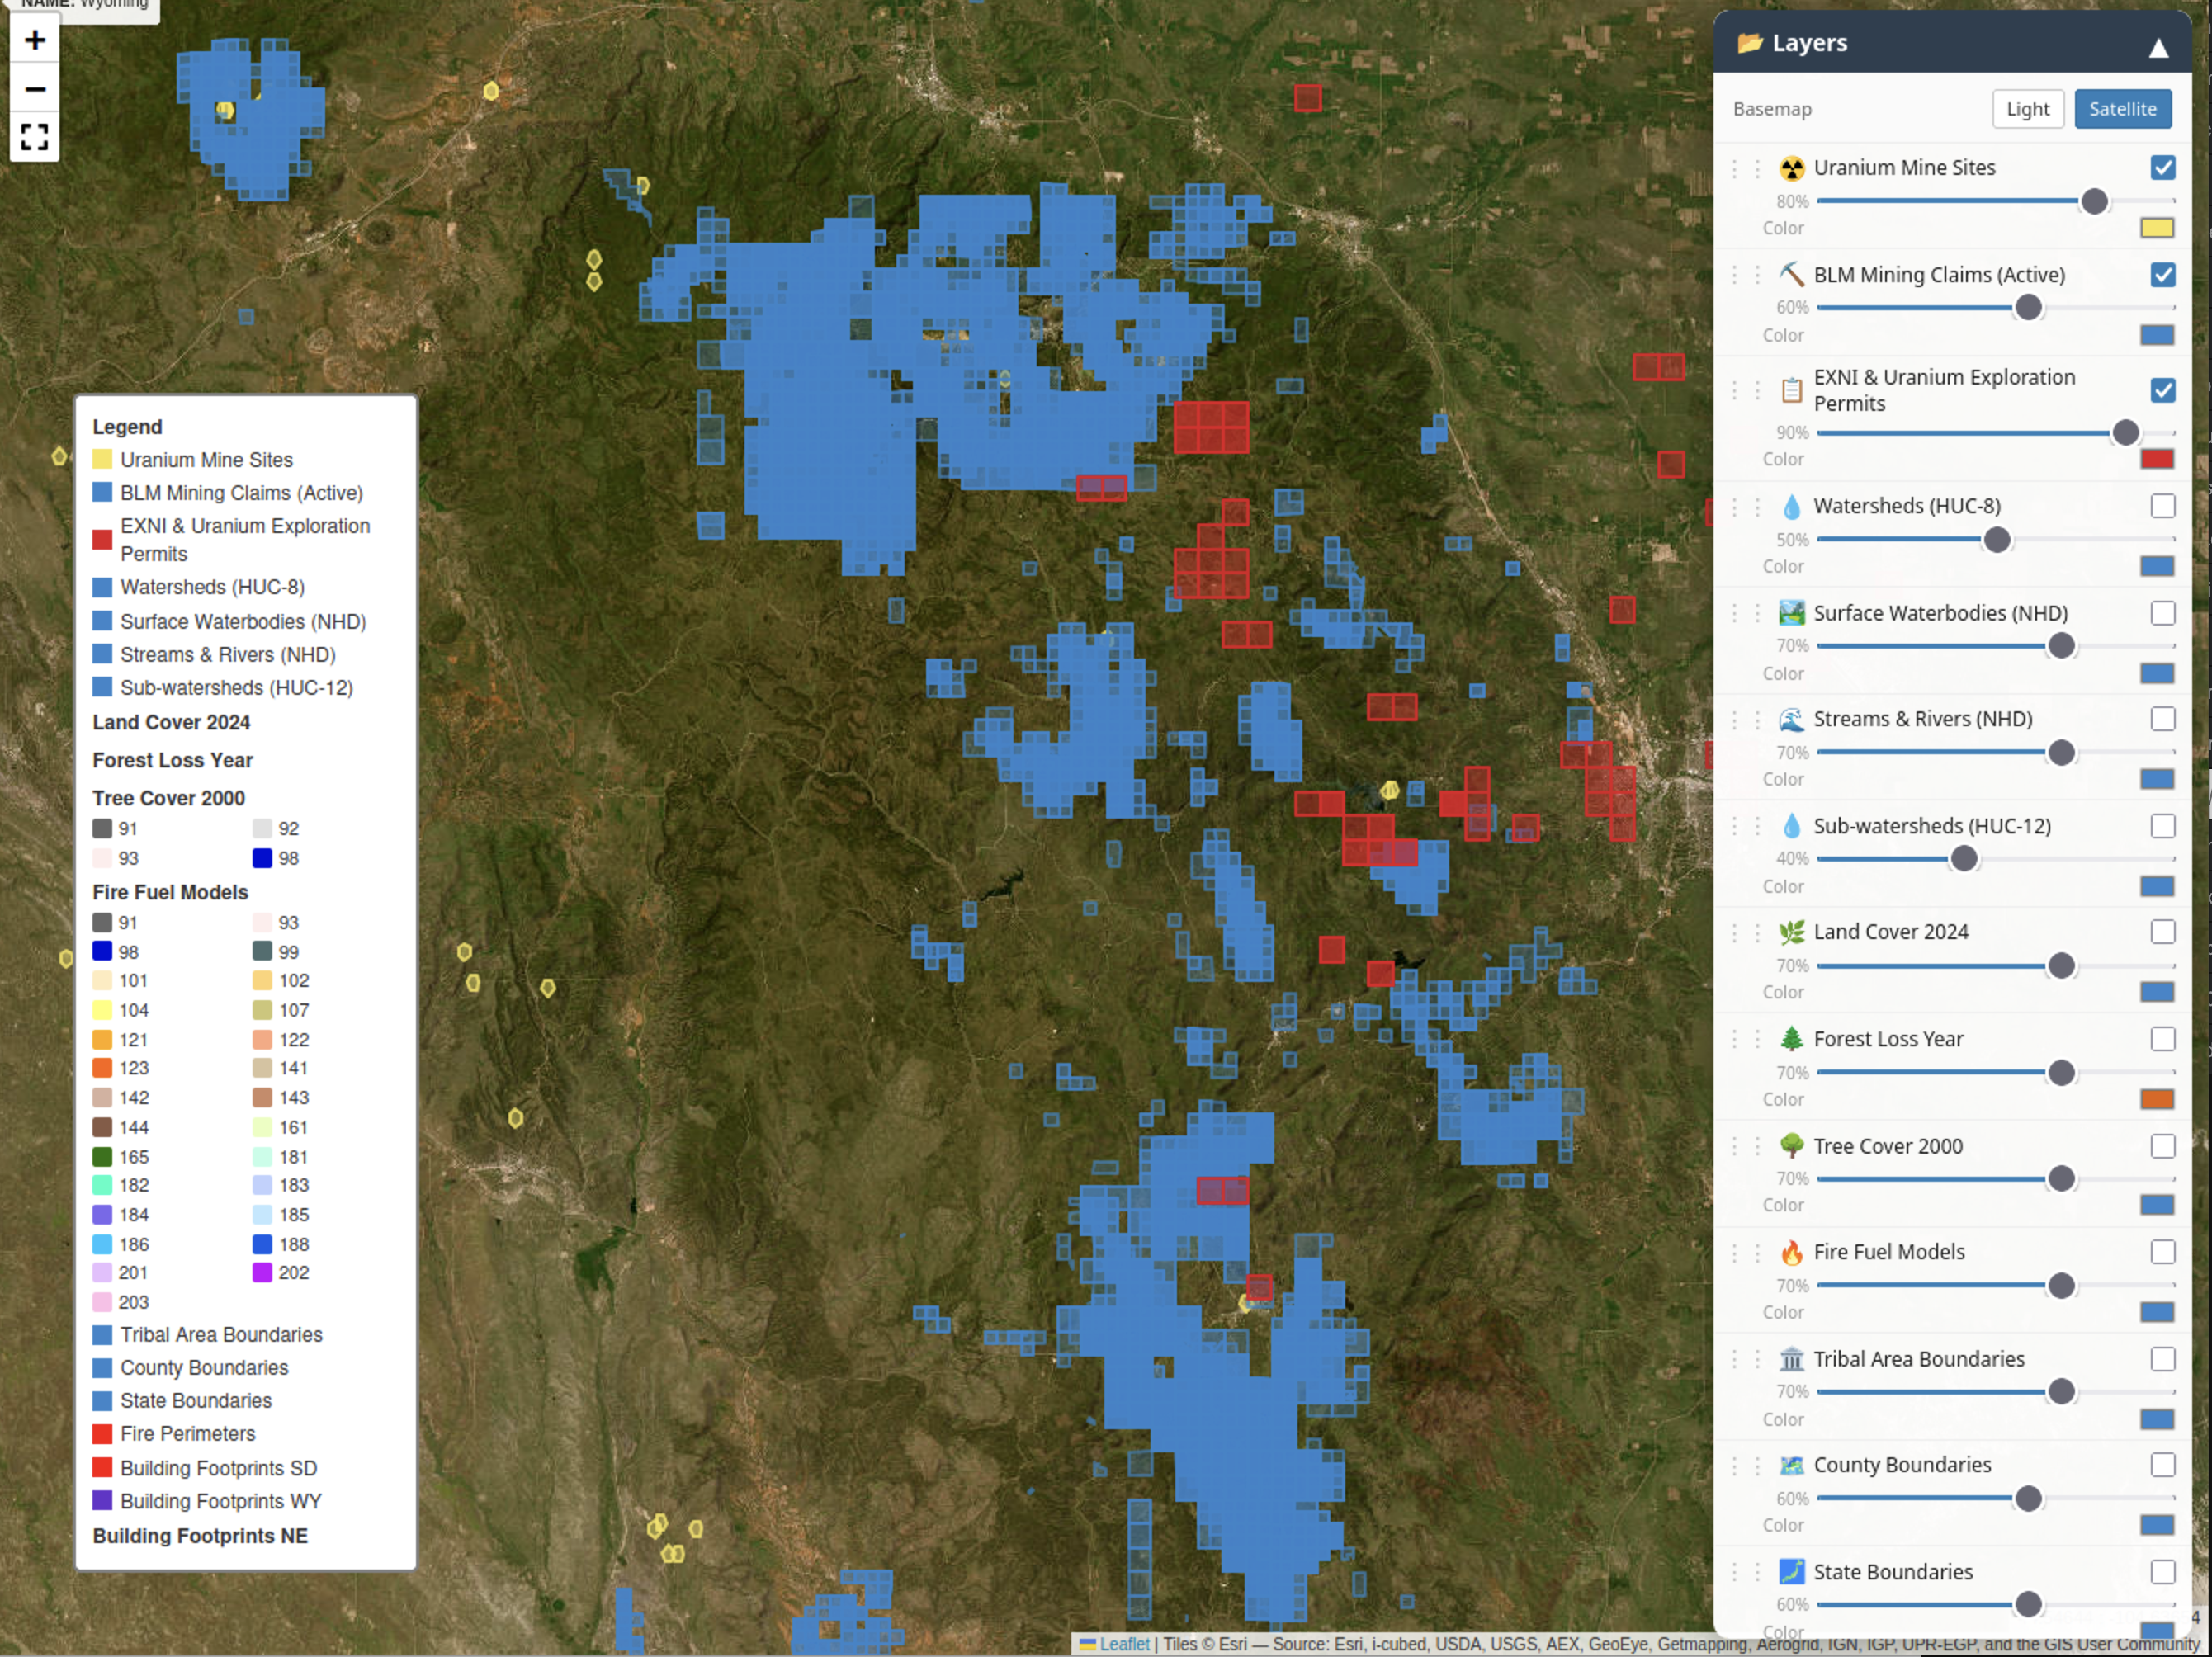
- Acquire mining permit information and geospatial locations of proposed and current mine sites
- Set up agentic AI to scrape and extract information from mining permits
- Gather and harmonize (agentic LLM) input data including:
-
- Topography (DEM)
- Climate (PRISM, Temp/Precip)
- Geologic Maps
- Land Use / Land Cover
- Stremflow data (USGS)
-
- streamstats tool
- OpenET for Evapotranspiration data
- Snow cover
- SSURGO (soils)
Long term:
- Integrate two models for water quality monitoring:
-
- SWAT (Soil and Water Assessment Tool)
- Stream Vulnerability Index
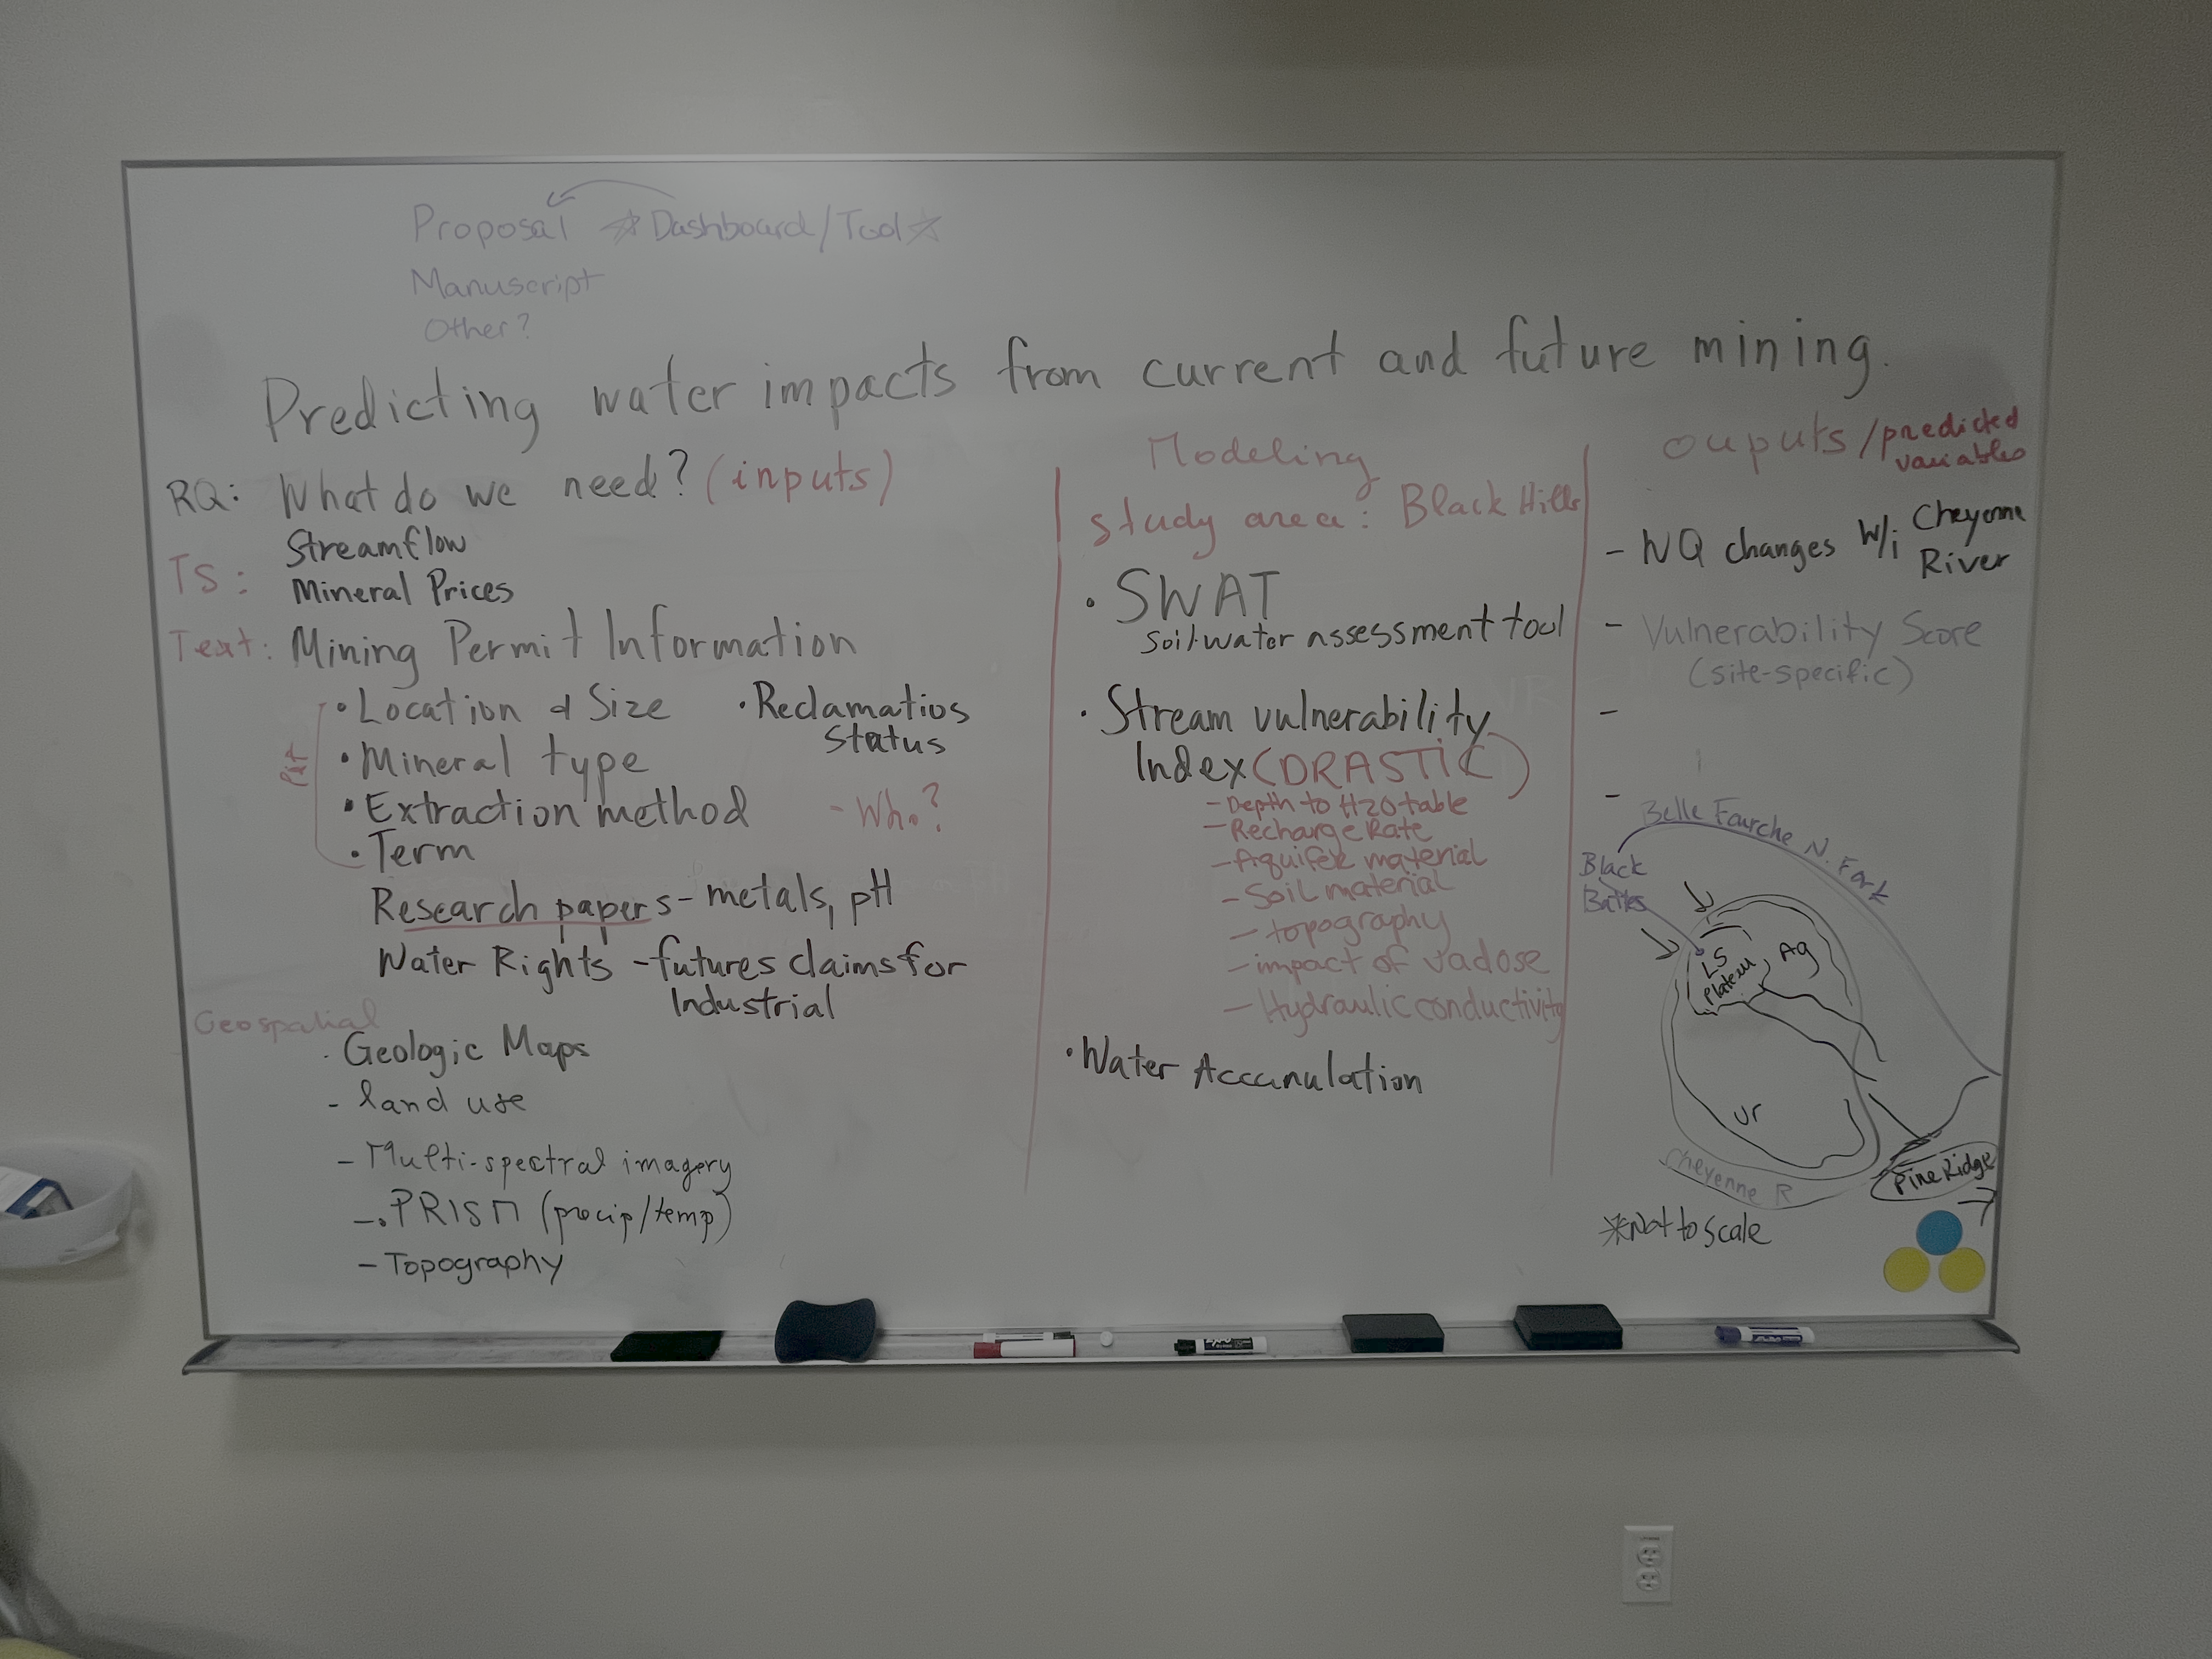
Morning whiteboard or notes showing the question, hypotheses, and context we used to start Day 2.
Our question(s) 📣
Our working question:
How are existing and proposed mine sites in the Black Hills region of South Dakota impacting water resources downstream? How are sacred sites in Black Hills geogrpahically related to proposed mining exploration?
What would count as progress:
Progress might look like a framework for a Digital Twin for the Black Hills region that can integrate water impact models (e.g., SWAT). A case study integrating mining permits and water modeling would be ideal! Eventually, we want a dashboard to allow users to explore potential impacts at a gievn location.
Hypotheses/Intentions [Optional: probably not relevant if you are creating an educational tool]
Why this matters (the “upshot”) 📣
This matters because:
...
People who could use this:
...
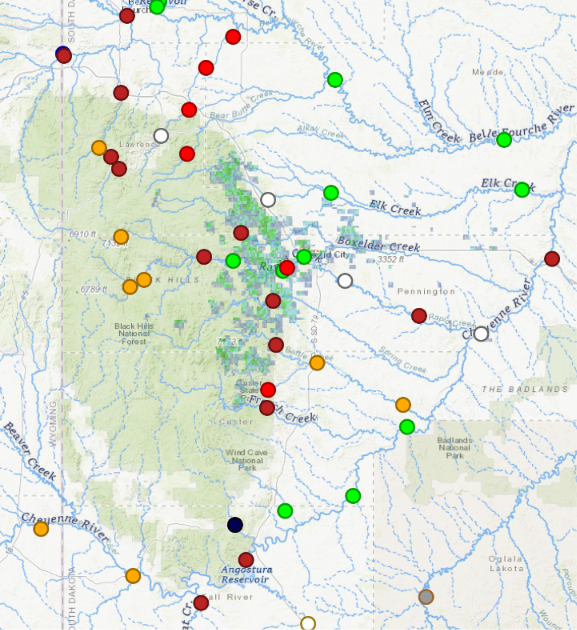
Data sources we’re exploring 📣
!!! note "data exploration" Provide a snapshot showing some initial data patterns.
Add 2-4 promising data sources (links +1-line notes)
Snapshot showing initial data patterns.
Promising data sources:
- Data source 1: ...
- Data source 2: ...
- Data source 3: ...
- Data source 4: ...
Methods/technologies we’re testing 📣
!!! note "methods" Add 2-4 methods/technologies we're testing (stats, models, viz).
- LLM/agentic harmonization of input data (topography, weather, streamflow, geology, land use, etc.)
- LLM-based PDF scraping of mine permit information (location, type, etc.)
- SWAT (Soil and Water Assessment Tool)
- Stream Vulnerability Index
View shared code{ .md-button }
Methods/technologies we are testing:
| Method or technology | What we tested | Early note |
|---|---|---|
| ... | ... | ... |
| ... | ... | ... |
| ... | ... | ... |
| ... | ... | ... |
Challenges identified
- Finding mine permits and extracting geographic information
- Water quality data is sparse
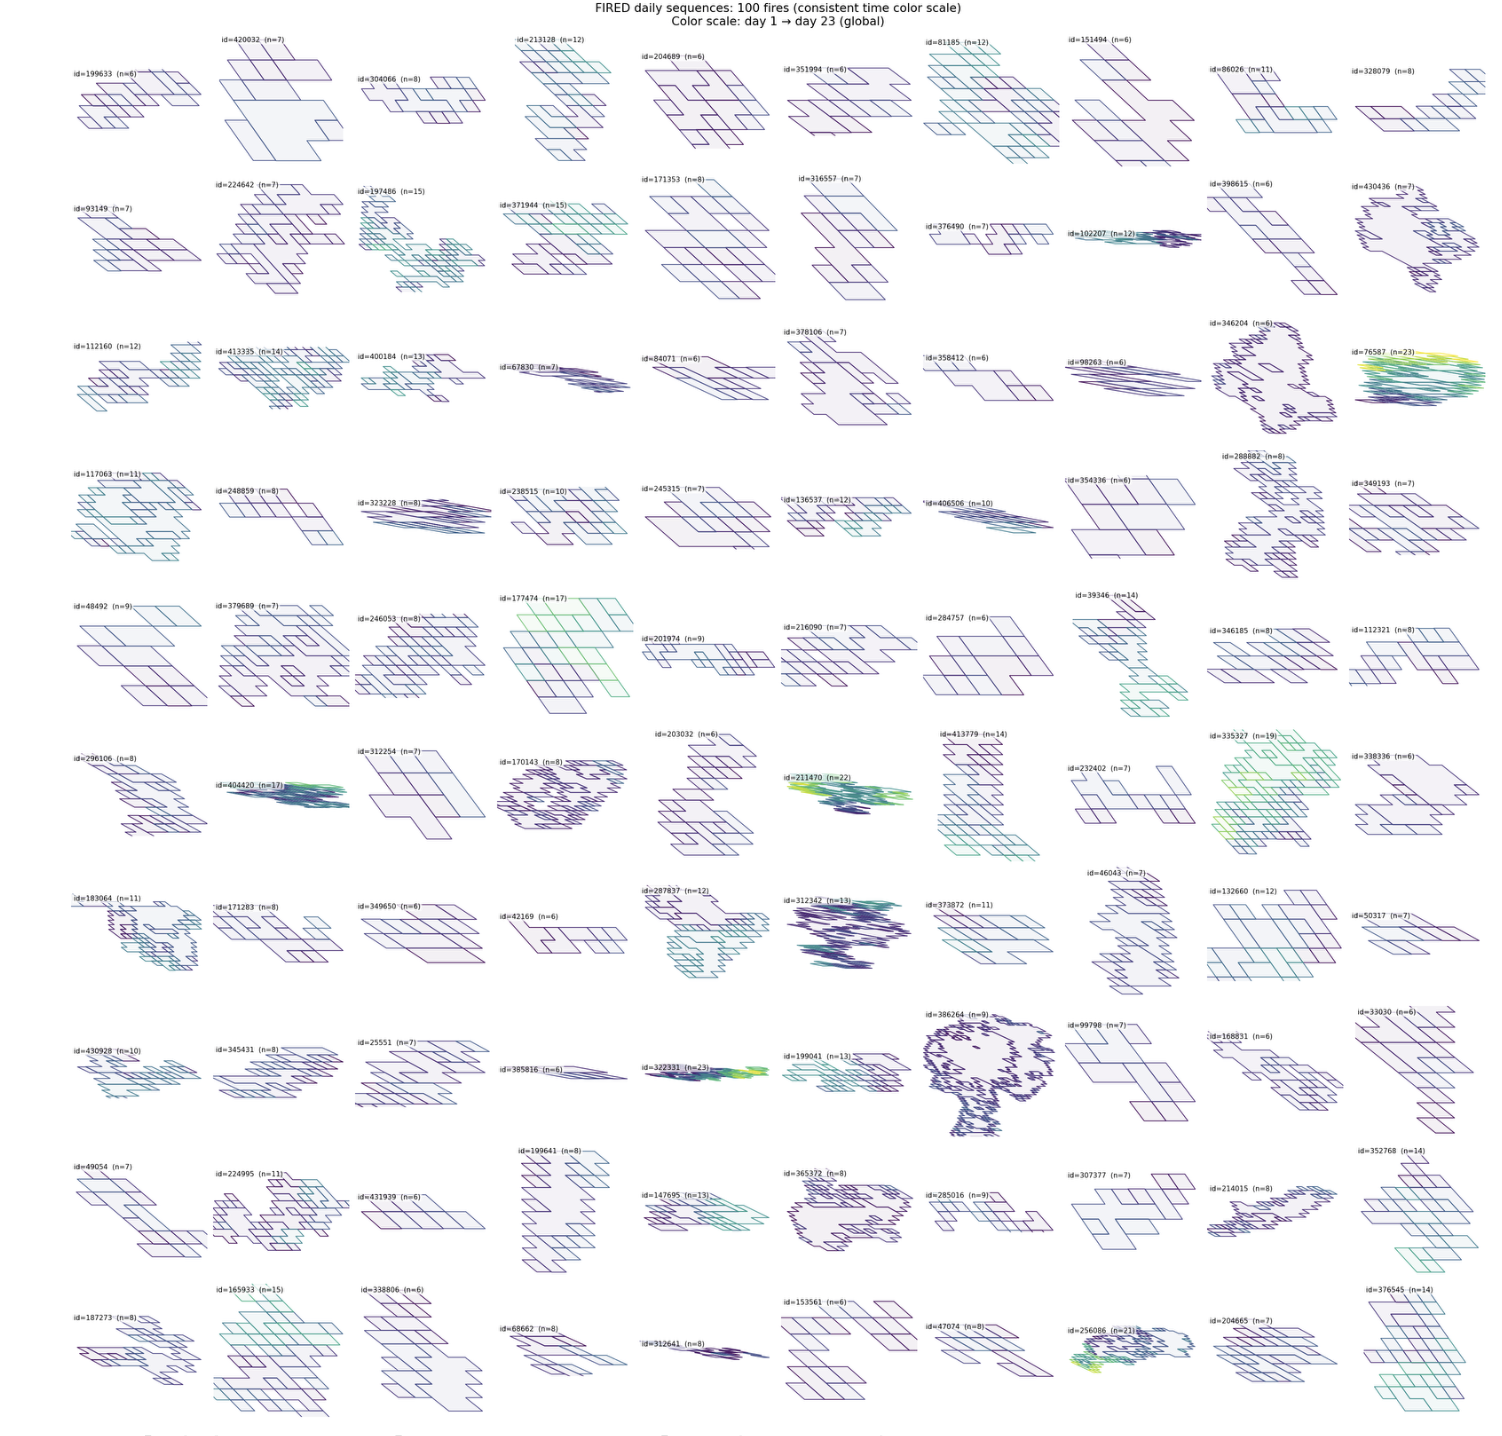
Visuals
Next Steps
Short term:
Long term:
!!! note "Day 3 Tasks" Sythesis: highlight 2-3 visuals that tell the story; keep text crisp. Practice a 6-minute walkthrough of the homepage. Why -> Questions -> Data/Methods -> Findings -> Next
[Edit content below here in Markdown](https://github.com/CU-ESIIL/Summit_group_2026_13/edit/main/docs/index.md?plain=1#L203){ .md-button target="_blank" rel="noopener" }
Team members and collaborators who contributed to this project.
Findings at a glance 📣
Headline 1 — what, where, how much
...
Headline 2 — change/trend/contrast
...
Headline 3 — implication for practice or policy
...
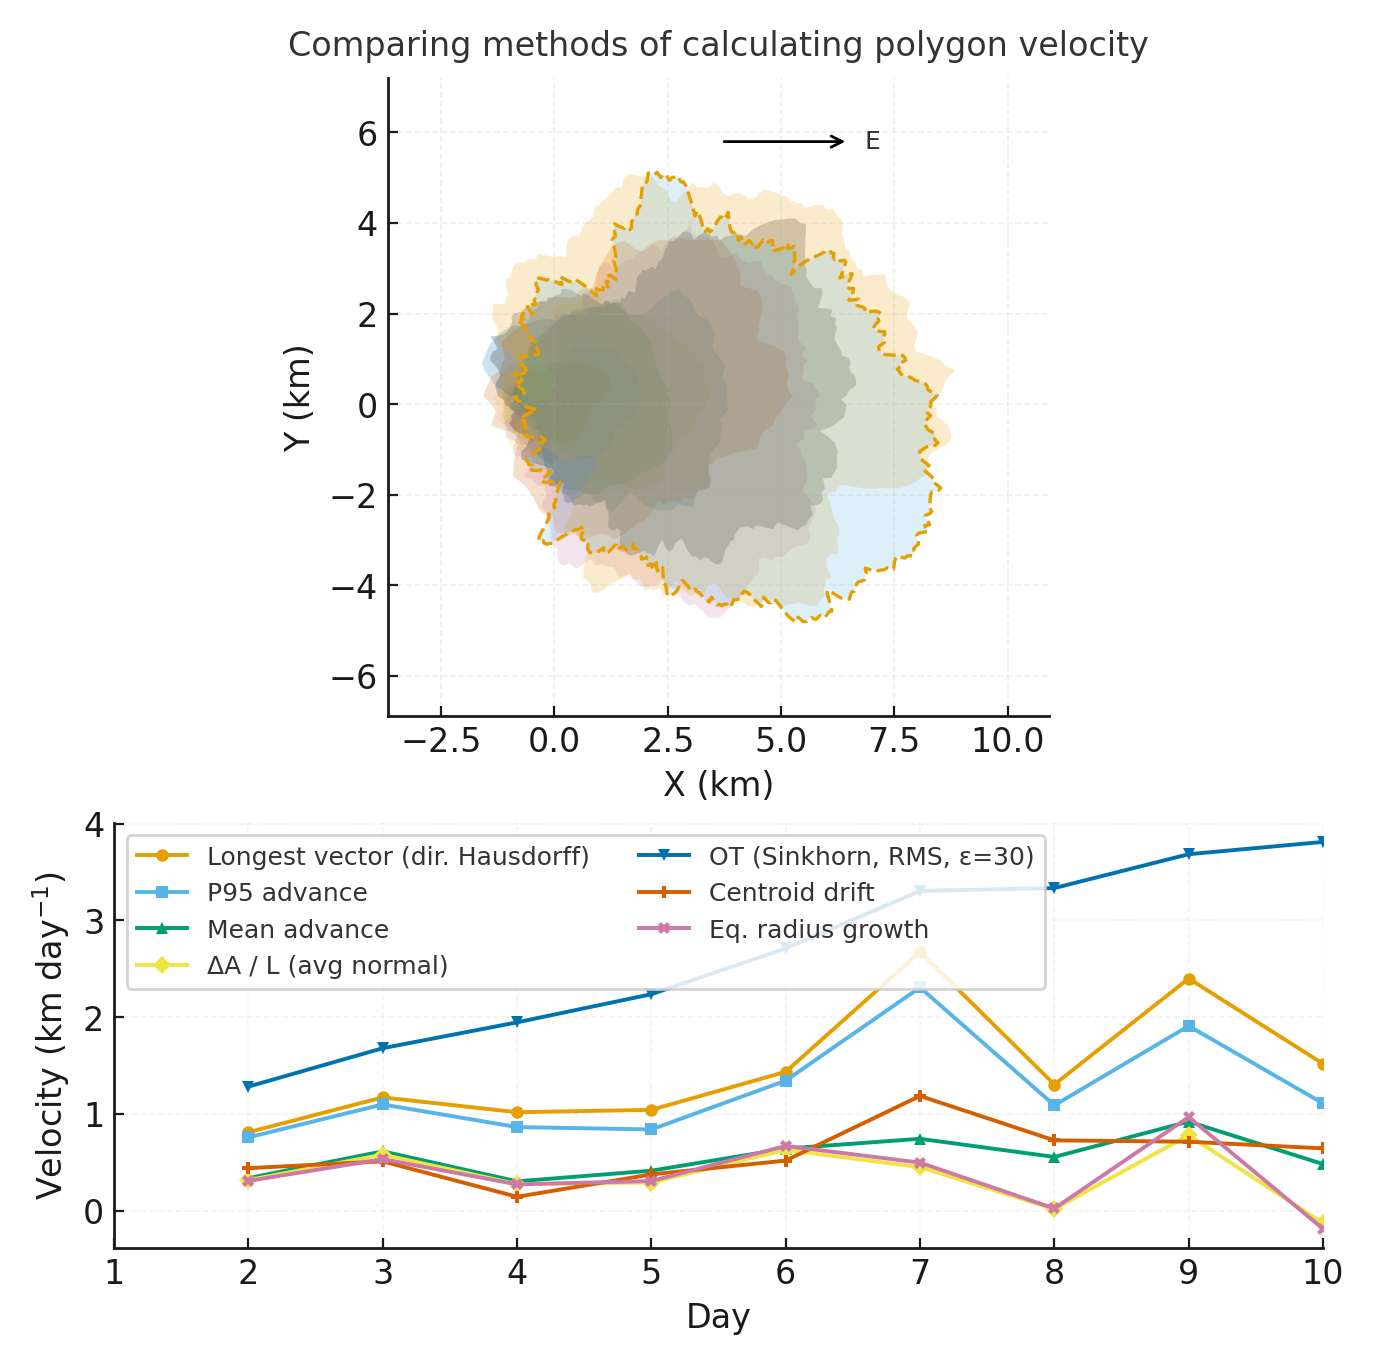
Visuals that tell a story 📣
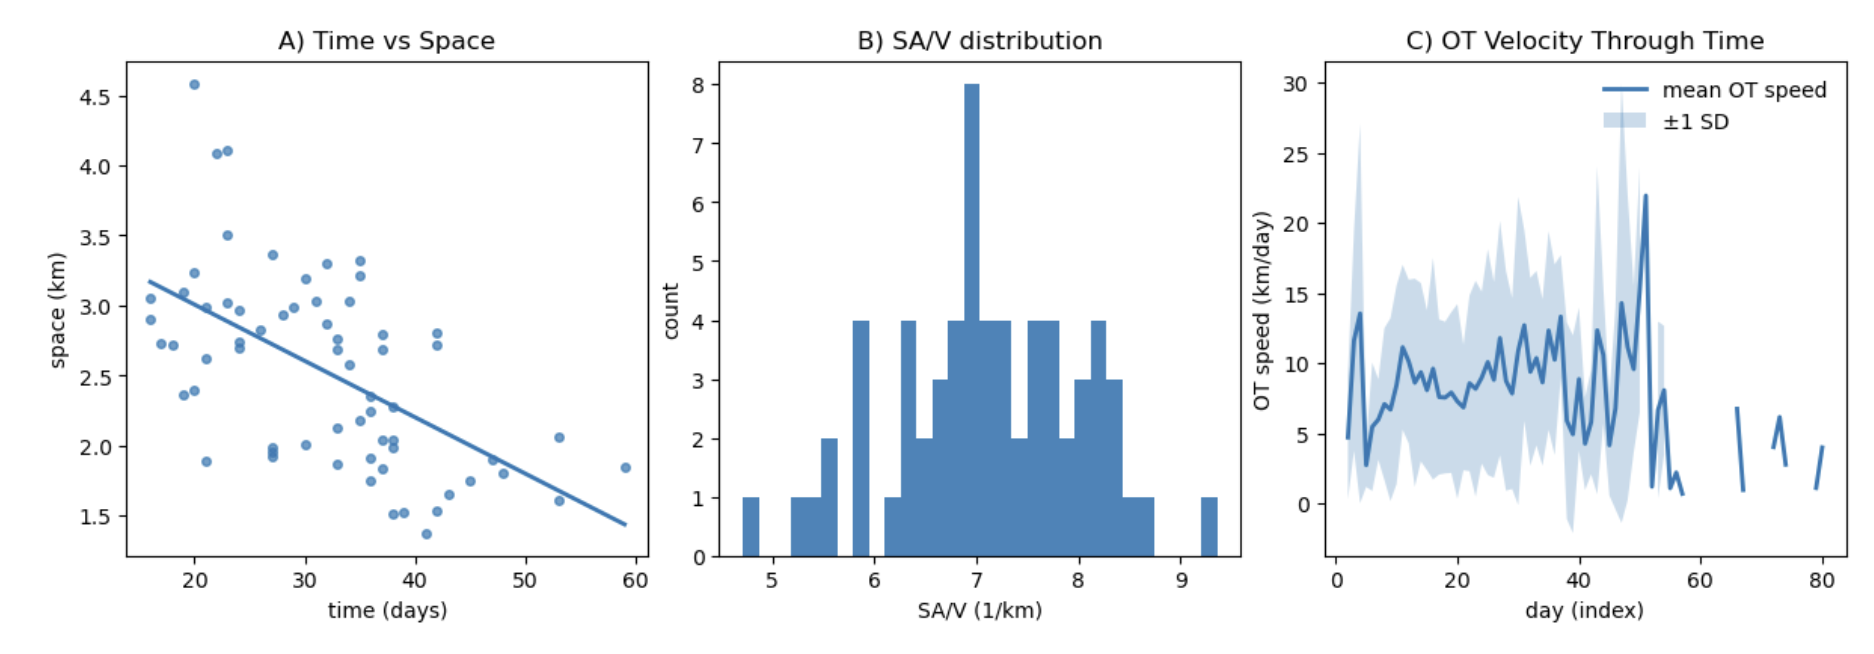
Visual 1: the main pattern or output we want people to remember.
What’s next? 📣
Short term:
- ...
Long term:
- ...
Who should see this next
- ...
Cite & Reuse
If you use these materials, please cite:
Summit Team. (2026). Summit Group 2026 Team 13 — Innovation Summit 2026. https://github.com/CU-ESIIL/Summit_group_2026_13
License: CC-BY-4.0 unless noted.