Home
Working Group: Tracking vegetation transformations through network topology shifts
This working group runs as a single system: a GitHub repository where environmental data science is organized, analyzed, and versioned, and a public website where results are explained and shared with the community.
As the working group progresses, the repository becomes the reproducible record of the science, and the website becomes the public report.
Edit this homepage in GitHub Open the GitHub repository
--8\<-- "_generated/slot_notes/hero.md"
Working Group Abstract
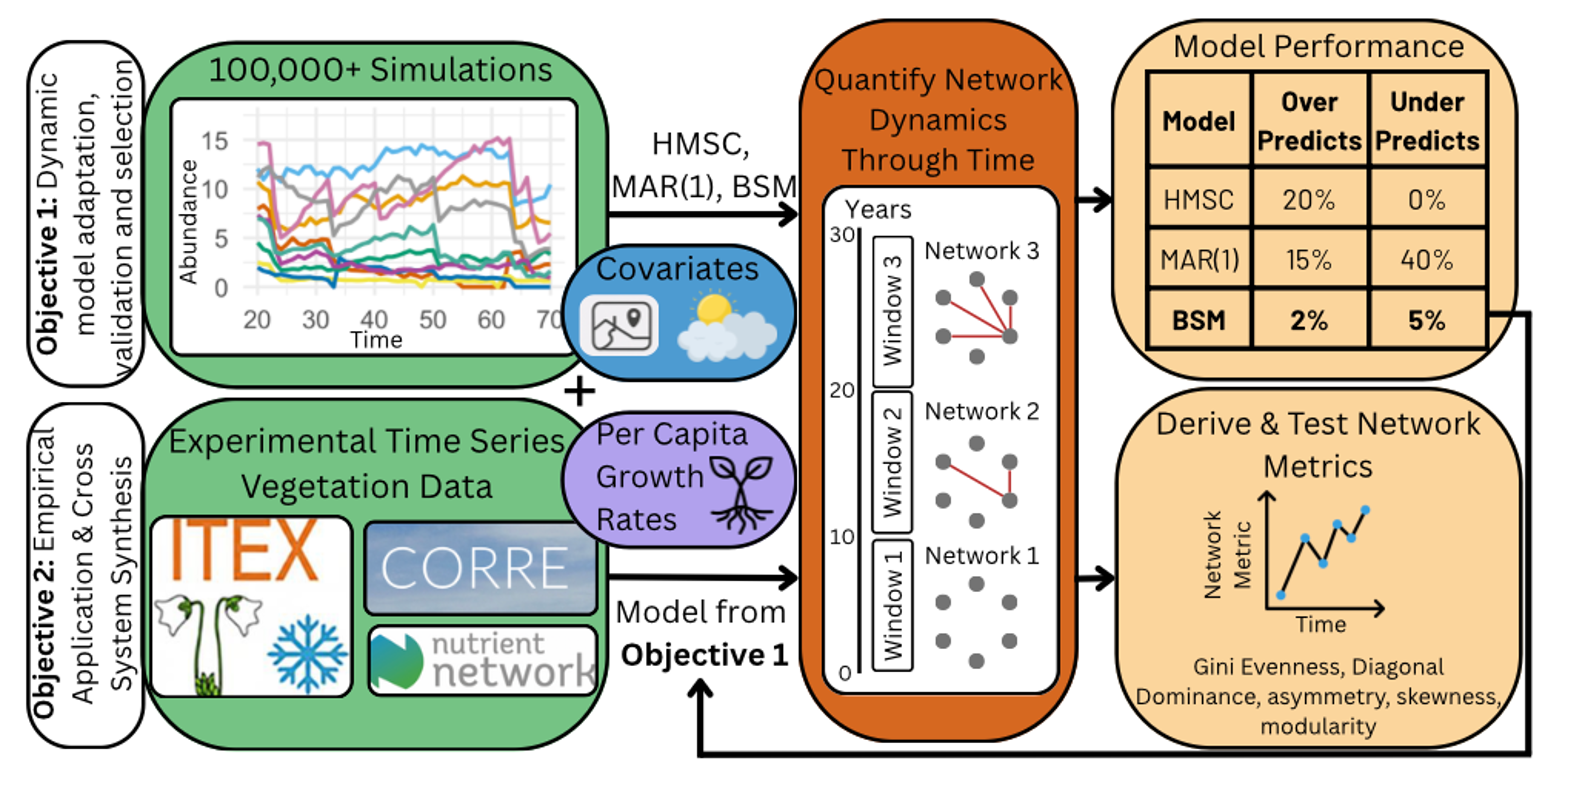
Climate change and human disturbance are rapidly transforming plant communities. Yet, we still struggle to recognize when and how ecological communities are reorganizing. This working group will create new ways to detect these hidden transformations by studying the networks of relationships that link species together. Instead of looking only at which plants are present or how much ground they cover, we focus on the web of connections that keep ecosystems functioning--and how these connections shift under stress. Around the world scientists have been collecting detailed records of plant communities for decades, but these rich datasets haven’t been used to understand the relationships among species. By combining decades of long-term vegetation data from drought, grazing, nutrient, and climate experiments we will ask: do similar environmental pressures trigger similar patterns of ecological reorganization?
Start Here
- Replace the title and summary with the working group question, the community or scientific need, and the main outputs the group expects to produce.
- Add or link the datasets, working documents, and references your group will use.
- Run or adapt at least one analysis workflow and record decisions in the repository.
- Commit figures, tables, notes, and summaries so the work is versioned and reproducible.
- Use the website to share progress, methods, and results with collaborators and community audiences.
Plan the work Document data and resources Set community expectations
Working Group Landmarks
Use these lightweight labels to connect work sessions, meeting notes, and homepage edits:
WG-A People and roles; WG-B Question and scope; WG-C Data and access; WG-D Methods and workflows; WG-E Results and synthesis; WG-F Outputs and handoff.
How This Repo Is Organized
The repository has two connected layers. Top-level files configure the project and its automation. The docs/ folder contains the website content. mkdocs.yml tells MkDocs how to turn that content into the public site. Analysis folders hold the working scientific materials that generate the results shown on the website.
| Part of the repo | What it does | What usually belongs there |
|---|---|---|
| Top-level files and folders | Configure the project and keep shared repository guidance in one place | README.md, LICENSE, workflows, containers, templates, environment setup, and repo-wide metadata |
docs/ |
Stores the source content for the public website | Homepage text, summaries, methods, community-facing documentation, and website assets |
mkdocs.yml |
Controls how the site is rendered | Navigation, theme settings, plugins, and GitHub edit links |
| Working folders | Hold the science-in-progress | Data references, notebooks, scripts, workflows, figures, outputs, and reproducibility materials |
Repository Side: Do the Science
Related landmarks: WG-C Data and access; WG-D Methods and workflows.
The repository is the working record of the group: it tracks what changed, why it changed, and how results were produced.
- Data sources and metadata
- Notebooks and scripts
- Workflows and reproducible analysis
- Meeting notes and decisions
- Figures, tables, and other outputs
Website Side: Share the Science
Related landmarks: WG-E Results and synthesis; WG-F Outputs and handoff.
The website turns the working group record into a readable public report.
- Plain-language summaries
- Methods documentation
- Figures, maps, and visualizations
- Meeting outputs and synthesis products
- Manuscripts, reports, or educational materials
How the Two Sides Connect
The repository and website are not separate products. When the group updates data, analysis code, figures, or written summaries in GitHub, those changes can be rendered through the website. Commits are the bridge between doing the science and sharing the science.
When This Working Group Is Live
A working group is live when:
- The research question is stated
- Data sources are linked or documented
- At least one analysis or workflow is runnable
- Outputs are committed to the repository
- The website explains what the group is doing and why it matters
For guidance on turning this scaffold into a public scientific record, see the Public-Facing Site Guide.
Key Links
- Main Working Document: https://github.com/CU-ESIIL/species-interaction-topologies/blob/main/docs/index.md
- GitHub Repository: https://github.com/CU-ESIIL/species-interaction-topologies
- Data / Resources: [link]
- Outputs / Dashboard: [link]
Current Phase
Working Phase: Preparing for Meeting 1 and collaborating remotely
Team Members
Related landmark: WG-A People and roles.
--8\<-- "_generated/slot_notes/group-photo.md"
| Name | Role | Institution | Responsibilities |
|---|---|---|---|
| Katy Suding | PI | University of Colorado, Boulder | Guide science |
| Annie Meader | Group Lead | University of Colorado, Boulder | Simulations, model testing and validation |
| Lauren Shoemaker | Co-PI | University of Wyoming | Science |
| Lauren Hallett | Co-PI | University of Oregon | Science |
| Topher Weiss-Lehman | Co-PI | University of Wyoming | Science |
| Chhaya Werner | Co-PI | Southern Oregon University | Science |
| Megan Szojka | Post-doc | Science | |
| Jasmin Albert | PhD Candidate | University of Oregon | Science |
| Sage Ellis | PhD Student | University of Wyoming | Science |
| Dusty Gannon | Technical Lead | Oregon State University | Research and Manage computational workflows and compute resources |
--8\<-- "_generated/image_slots.md"