gridmet · methods and QA examples
Provider, product, coverage, units and source status have one canonical home: gridmet source reference. This page preserves the operational example, reviewed figure and source citations.
Quickstart
Get the stream (CubeDynamics grammar)
import cubedynamics as cd
from cubedynamics import pipe, verbs as v

cube = cd.gridmet(
    lat=40.0,
    lon=-105.25,
    start="2020-06-01",
    end="2020-06-30",
    variable="tmmx",
)

pipe(cube) | v.mean(over="time") | v.plot()
Preview plot
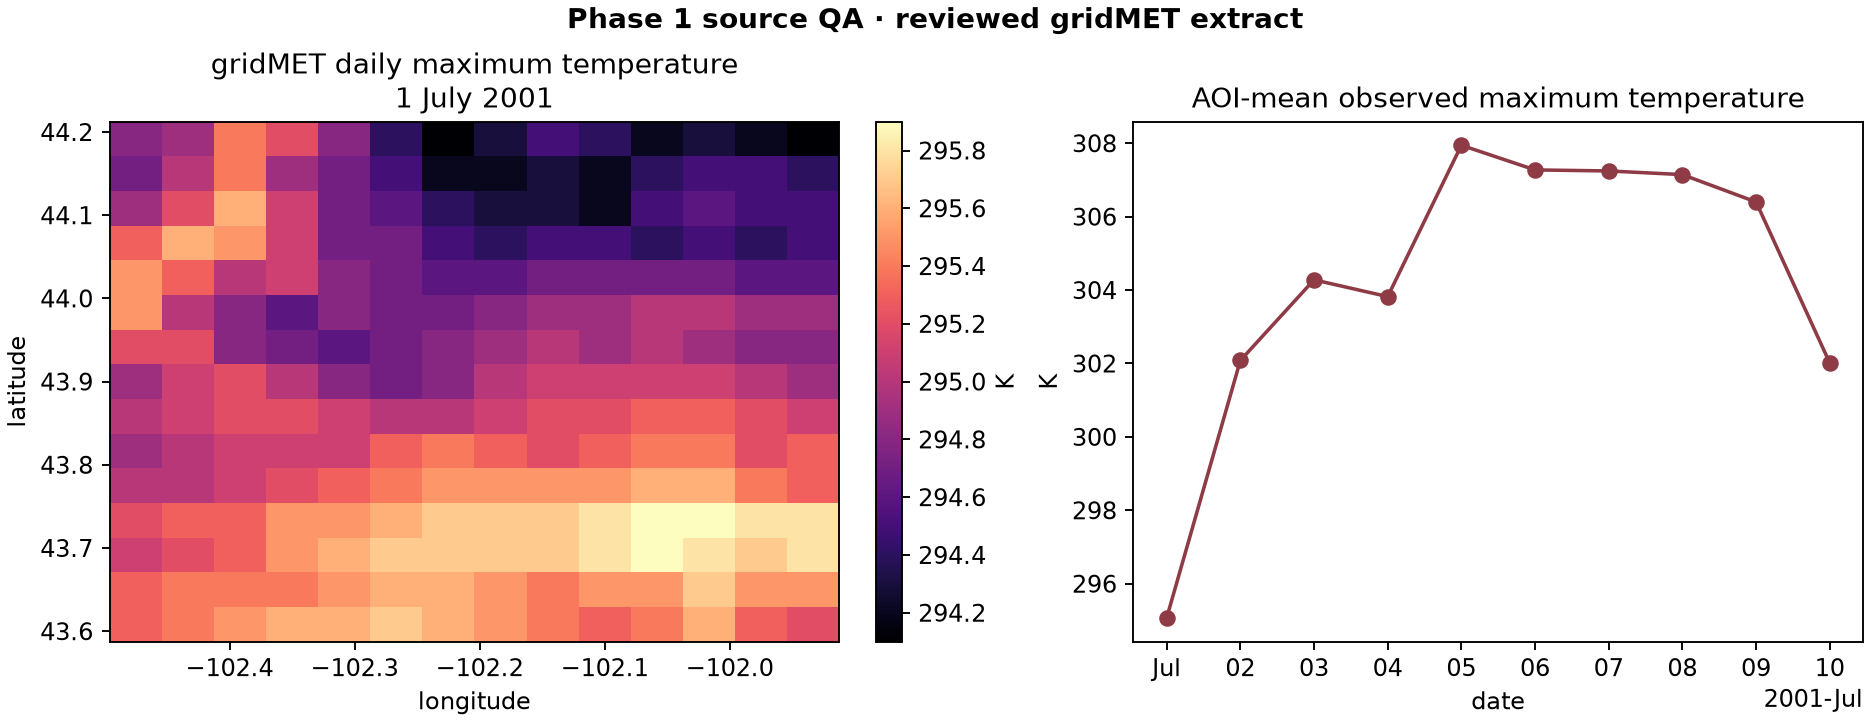
This is a checksum-controlled observational gridMET extract over southwestern South Dakota. It shows one daily maximum-temperature map and the ten-day AOI-mean series; it is validation evidence rather than a decorative thumbnail.
Regenerate this plot
-
Rebuild the small observational fixtures when source review is required:
python python scripts/build_phase1_qa_fixtures.py -
Run
python scripts/run_source_qa.py. The offline workflow checks the fixture checksum, source and CRS, dates, bounds, coordinate orientation, grid resolution, missingness, and broad physical temperature range.
See the complete Phase 1 source QA report. The runtime now prefers AOI-bounded reads through the provider's documented OPeNDAP catalog when an OPeNDAP-capable xarray engine is installed, retaining annual HTTPS as a compatibility fallback.
Citation
Abatzoglou, J. T. (2013). Development of gridded surface meteorological data for ecological applications. International Journal of Climatology, 33(1), 121–131. https://doi.org/10.1002/joc.3413
See also: Fire event vase + climate merge (fire_plot)
Back to Datasets Overview Next recommended page: Which dataset should I use?