Which dataset should I use?
Choose a dataset based on spatial coverage, revisit cadence, and the variables you need: - gridMET: Daily CONUS meteorology (precipitation, temperature, humidity, wind) at ~4 km; best for climate summaries and anomalies. - PRISM: High-quality CONUS precipitation and temperature with long-term consistency; ideal for climatology and terrain-aware normals. - Sentinel-2 NDVI: 10 m vegetation condition with 5-day revisit; best when spatial detail matters and cloud filtering is acceptable. - Landsat 8 (MPC): 30 m multispectral reflectance with long archive; use when temporal depth and surface reflectance are key. - FIRED: Event and daily fire perimeters; pair with climate cubes to build fire-aware analyses and visualizations.
Inspect the support of a source comparison
The temperature noun compares implemented source metadata. The following real samples demonstrate why inspecting dates, geography and units must come before subtraction. They are not co-located or contemporaneous. A paired empirical comparison must wait for a reviewed overlapping extract; the documentation makes no new network request to manufacture one. Daymet is not an implemented noun flavor.
REAL DATA · Reviewed PRISM and gridMET extracts; different places and dates.
Reproduce: imports, checked data and setup
Run in a clone after python -m pip install -e '.[vignettes]'.
from pathlib import Path
import hashlib
import json
import numpy as np
import pandas as pd
import xarray as xr
import matplotlib.pyplot as plt
from IPython.display import display
from cubedynamics import pipe, verbs as v

# Run in the cloned repository or beside a downloaded notebook in the repo.
repo = next(p for p in (Path.cwd(), *Path.cwd().parents)
            if (p / "tests/fixtures/real_data").is_dir())

def observed_cube(stem, variable):
    path = repo / "tests/fixtures/real_data" / (stem + ".nc")
    record = json.loads(path.with_suffix(".provenance.json").read_text())
    assert hashlib.sha256(path.read_bytes()).hexdigest() == record["fixture_sha256"]
    with xr.open_dataset(path, engine="scipy") as dataset:
        assert not dataset.attrs["is_synthetic"]
        result = dataset[variable].load()  # Only this small, reviewed local extract.
        result.attrs = {**dataset.attrs, **result.attrs}
    assert result.dims == ("time", "y", "x")
    assert np.all(np.diff(result.x) > 0) and np.all(np.diff(result.y) < 0)
    assert bool(np.isfinite(result).all())
    return result

cube = observed_cube("prism_boulder_january_2024", "tmax").rename("temperature")
assert cube.attrs["units"] == "degC"

plt.rcParams.update({'font.family': 'DejaVu Sans', 'font.size': 12, 'axes.titlesize': 13, 'axes.labelsize': 12, 'figure.facecolor': 'white', 'axes.facecolor': 'white', 'savefig.facecolor': 'white', 'figure.dpi': 140})
Inspect source support before comparing
Are these two reviewed samples suitable for a paired source comparison?
gridmet = observed_cube("gridmet_badlands_july_2001", "temperature")
assert gridmet.attrs["units"] == "K"
# No conversion, resampling, or date alignment is hidden here.
assert not np.intersect1d(cube.time.values, gridmet.time.values).size

fig, axes = plt.subplots(2, 1, figsize=(5.4, 6.5), layout="constrained")
cube.isel(time=0).plot(ax=axes[0], cmap="magma", cbar_kwargs={"label": "PRISM (°C)"})
gridmet.isel(time=0).plot(ax=axes[1], cmap="magma", cbar_kwargs={"label": "gridMET (K)"})
for ax, title in zip(axes, ["PRISM · Boulder · 1 January 2024", "gridMET · Badlands · 1 July 2001"]):
    ax.set(title=title, xlabel="Longitude (°E)", ylabel="Latitude (°N)")
plt.show()
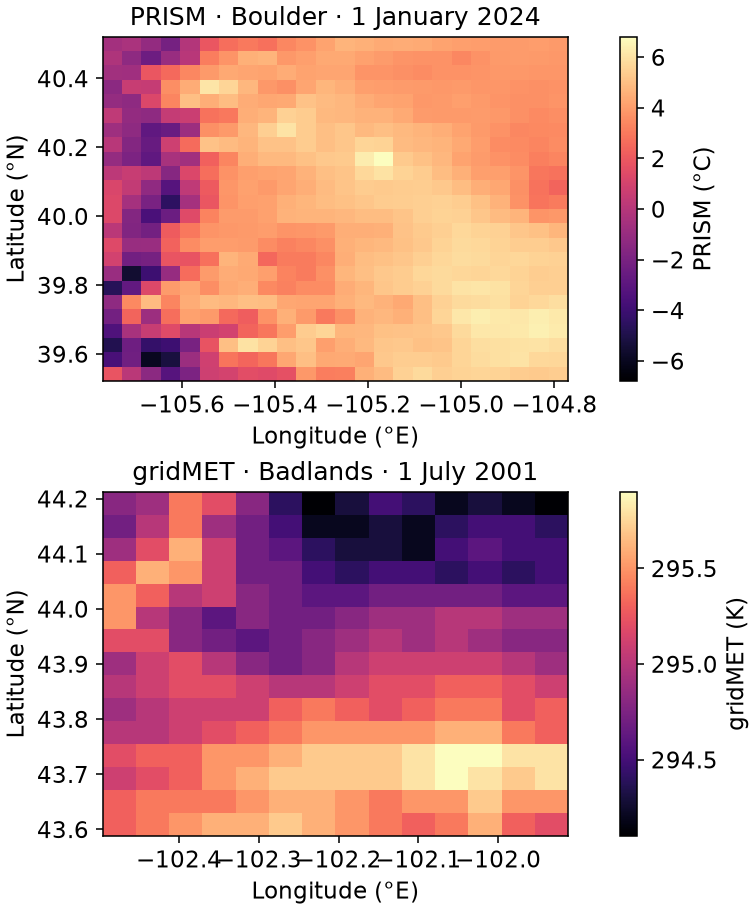
What changed? These samples cannot support a paired temperature comparison. Obtain overlapping AOIs and dates, explicitly convert K to °C, and choose a spatial alignment method before comparing products. Native grid cells are approximately 4 km, not identical spatial support.
Back to Datasets Overview
Next recommended page: Compatibility matrix