Library · Noun reference
temperature
Gridded air temperature, with an explicit daily statistic.
See the field
A frozen PRISM extract shows what this implemented noun represents. The live noun loader is documented below; this illustration does not make a live request.
REAL DATA · Reviewed local PRISM observations; no live request.
Reproduce: imports, checked data and setup
Run in a clone after python -m pip install -e '.[vignettes]'.
from pathlib import Path
import hashlib
import json
import numpy as np
import pandas as pd
import xarray as xr
import matplotlib.pyplot as plt
from IPython.display import display
from cubedynamics import pipe, verbs as v

# Run in the cloned repository or beside a downloaded notebook in the repo.
repo = next(p for p in (Path.cwd(), *Path.cwd().parents)
            if (p / "tests/fixtures/real_data").is_dir())

def observed_cube(stem, variable):
    path = repo / "tests/fixtures/real_data" / (stem + ".nc")
    record = json.loads(path.with_suffix(".provenance.json").read_text())
    assert hashlib.sha256(path.read_bytes()).hexdigest() == record["fixture_sha256"]
    with xr.open_dataset(path, engine="scipy") as dataset:
        assert not dataset.attrs["is_synthetic"]
        result = dataset[variable].load()  # Only this small, reviewed local extract.
        result.attrs = {**dataset.attrs, **result.attrs}
    assert result.dims == ("time", "y", "x")
    assert np.all(np.diff(result.x) > 0) and np.all(np.diff(result.y) < 0)
    assert bool(np.isfinite(result).all())
    return result

cube = observed_cube("prism_boulder_january_2024", "tmax").rename("temperature")
assert cube.attrs["units"] == "degC"

plt.rcParams.update({'font.family': 'DejaVu Sans', 'font.size': 12, 'axes.titlesize': 13, 'axes.labelsize': 12, 'figure.facecolor': 'white', 'axes.facecolor': 'white', 'savefig.facecolor': 'white', 'figure.dpi': 140})
Start with a temperature field
Where was the cold outbreak visible on 16 January?
field = cube.sel(time="2024-01-16")

fig, ax = plt.subplots(figsize=(5.4, 3.8), layout="constrained")
field.plot(ax=ax, cmap="magma", cbar_kwargs={"label": "Daily maximum (°C)"})
ax.set(title="PRISM · Boulder · 16 January 2024",
       xlabel="Longitude (°E)", ylabel="Latitude (°N)")
plt.show()
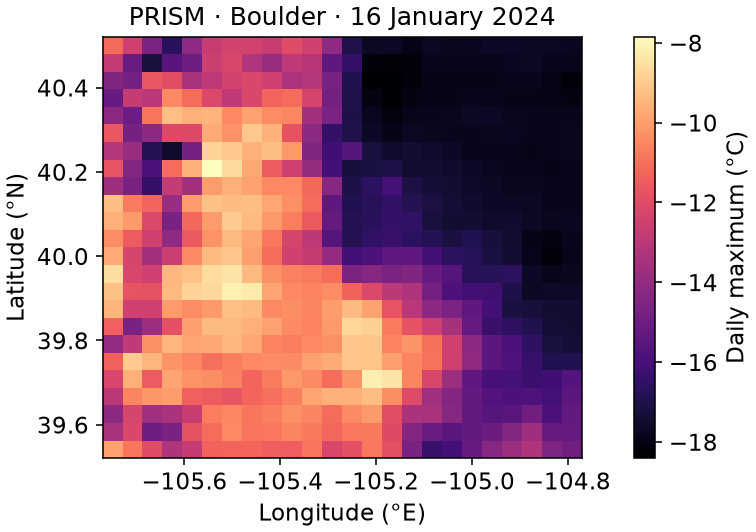
What changed? Each cell is a gridded estimate, not a station reading. This map shows absolute temperature; it does not yet say how unusual the day was.
Quick facts
| Fact | Value |
|---|---|
| Semantic type | Gridded environmental observations |
| Units by source | gridmet: maximum: K; minimum: K; prism: maximum: degC; minimum: degC; mean: degC |
| Spatial coverage | Contiguous United States |
| Temporal resolution | daily |
| Temporal support | gridmet: interval, calendar_day_starting; prism: interval, day_ending |
| Available source flavors | gridmet, prism |
Usage
data.temperature(*, source='gridmet', statistic='maximum', bbox=None, geometry=None, aoi_geojson=None, lat=None, lon=None, start=None, end=None, **kwargs)
Import with from cubedynamics import data. Keyword-only parameters and defaults above come from Python.
Available sources
| Source | Coverage | Resolution | Time | Selection constraint |
|---|---|---|---|---|
| gridmet | Contiguous United States | 4,638.3 m | 1979-present; daily | No native daily mean temperature variable; choose maximum or minimum. |
| prism | Contiguous United States | approximately 4 km | 1981-present; daily | Recent grids are revised as station data and quality control mature. |
Differences among source flavors
The same noun does not make these products numerically interchangeable. CubeDynamics does not silently harmonize units, grids, statistics, or revisions.
| Property | gridmet | prism |
|---|---|---|
| Units | maximum: K; minimum: K | maximum: degC; minimum: degC; mean: degC |
| Variables / statistics | maximum: tmmx; minimum: tmmn | maximum: tmax; minimum: tmin; mean: tmean |
| Spatial resolution | 4,638.3 m | approximately 4 km |
| Temporal resolution | daily | daily |
| Temporal support type | interval | interval |
| Temporal label convention | calendar_day_starting | day_ending |
| Temporal support start offset | 7h | -12h |
| Temporal support end offset | 31h | 12h |
| Coverage | Contiguous United States | Contiguous United States |
| Time span | 1979-present | 1981-present |
| Revision behavior | provider-managed daily observations in annual assets | daily observations with provider historical revisions |
| Source mode | rolling | rolling |
| Interpretation constraints | No native daily mean temperature variable; choose maximum or minimum. | Recent grids are revised as station data and quality control mature. |
Check units and statistic choice before comparing values; explicitly align spatial and temporal support. Record the serving revision and retrieval metadata from each result. Learn: provenance and source choice.
See the real-fixture support comparison: inspect native grids and units, and why non-overlapping samples cannot establish source agreement.
Returned data
An xarray.DataArray named temperature, normally with time, y, x dimensions. time stores acquisition/observation labels; y and x store grid coordinates in the declared CRS. Inspect the actual dimensions and CRS before combining sources.
Units are source-specific (above), not silently harmonized. Attributes include scientific_noun, source_flavor, source_variables, source_provider, source_product, spatial_query, temporal_query, temporal_support_type, temporal_label_convention, support offsets, crs, retrieved_at, data_state, and serving/schema provenance. See temporal alignment and provenance helpers.
Minimal reproducible example
Network example: requires the provider and its optional dependencies. This is a real-data request, not an offline certification. For frozen inputs, use the reviewed notebooks.
from cubedynamics import data
import matplotlib.pyplot as plt

cube = data.temperature(
    source="prism", bbox=[-105.55, 39.85, -105.05, 40.15],
    start="2024-06-01", end="2024-06-03",
)
cube.isel(time=0).plot()
plt.show()
Quality and provenance
| Source | Lifecycle | Revision | Revision status | Live health | QA profile |
|---|---|---|---|---|---|
| gridmet | implemented | temperature.gridmet@2026-08-26.1 | VALIDATED | STALE | climate_continuous_daily |
| prism | implemented | temperature.prism@2026-08-26.1 | VALIDATED | STALE | climate_continuous_daily |
Revision validity is not a claim that the live endpoint is available today. Certification evidence distinguishes reviewed fixtures from live checks. Each source's selection constraint above remains part of the interpretation.
See also
- Working Lands · Read hot-and-dry weather as two nouns
- 01 · From an array to a scientific cube
- 03 · Two variables, two questions
- 02 · From observations to a comparable signal
- 07 · Build a project-owned verb
- 04 · Read the analysis from left to right
- 08 · Stay lazy until the answer is requested
- 06 · From cold observations to event evidence
- 05 · One cube, six analytical views
- mean
- anomaly
- Learn: nouns
- Real-data vignettes
- All nouns