Library · Noun reference
streamflow
Observed discharge at an identified streamgage through time.
Quick facts
| Fact | Value |
|---|---|
| Semantic type | Station time series |
| Units | Native provider units; retained examples use ft^3/s |
| Source flavors | usgs |
| Access | Explicit bounded acquisition; optional offline snapshot replay |
Usage
from cubedynamics.data.usgs import streamflow

streamflow(*, site, start, end, source='usgs', series_id=None, snapshot_dir=None, offline=False)
The signature above is generated from the installed loader. Call acquisition before composing the analysis pipe.
Arguments
| Argument | Meaning | Default |
|---|---|---|
| site | One agency-prefixed monitoring location, e.g. USGS-06730200. | required |
| start | Timezone-aware beginning of the observation window. | required |
| end | Timezone-aware end, later than start; maximum 31 days. | required |
| source | Only usgs. | 'usgs' |
| series_id | Optional exact time-series identity; required if the query is ambiguous. | None |
| snapshot_dir | Optional new directory to retain exact responses; use a new directory for a live refresh. | None |
| offline | Replay verified snapshots only; never download missing content. | False |
Available sources
| Source | Coverage | Resolution | Time |
|---|---|---|---|
| usgs | One supported USGS station per request | Point station; native observation intervals | Provider-available observations; <=31-day requests |
Returned data
An xarray.Dataset with streamflow(time, station) for one station. Coordinates preserve station ID, location, time-series identity, record IDs, and native approval/qualifier/last-modified fields. Companion _present and _is_null flags distinguish absent, null, and empty values. UTC times, units, statistic, request window and raw-response provenance remain inspectable.
Order / grammar behavior
Use v.anomaly(dim='time') or v.mean(dim='time') and plot the streamflow variable. This is a point observation series, not a raster cube. Provisional values remain visible with warnings; comparison of stored snapshots is available through compare_observations in the same module.
Minimal reproducible example
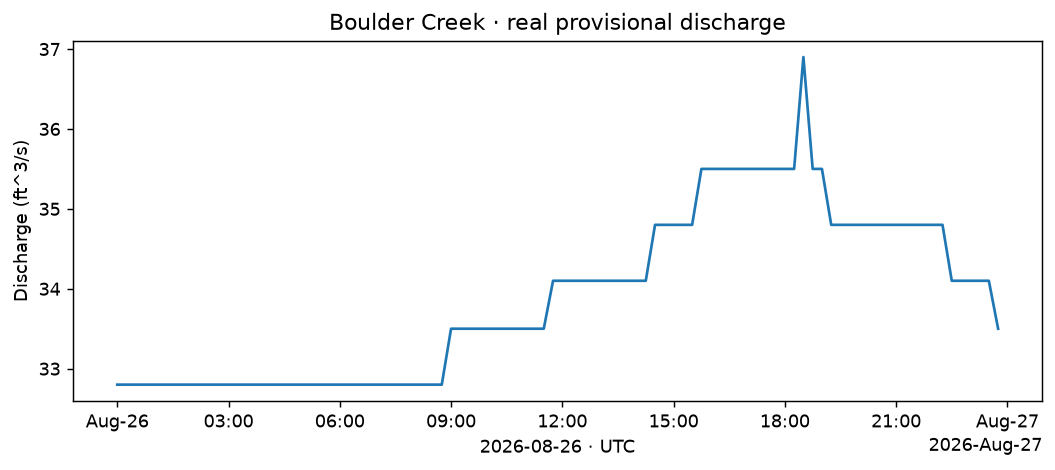
Live acquisition below requires network access and the source's optional dependencies. The complete offline lesson uses checksum-verified real inputs and shows a plot at every step.
from cubedynamics.data.usgs import streamflow
import matplotlib.pyplot as plt

observed = streamflow(site="USGS-06730200",
    start="2026-08-26T00:00:00Z", end="2026-08-26T23:59:59Z")
observed.streamflow.isel(station=0).plot()
plt.show()
See the data
Code and interpretation · Figure and input hashes
Quality and provenance
Implemented and documented here as a scientific noun. Operational certification remains bounded: no production serving revision has been assigned. Retained real-data samples, numerical/schema checks, and replay tests are distinct from broad scientific suitability or live-service guarantees.
- usgs: 10,000 observations; 40 requests / 16 MB bodies / 180 s. Preserve native units/statistic and provisional flags; missing values are not filled. Multiple series require explicit selection. No synthetic fallback.
Validation evidence and release gates. No automatic source switching or synthetic substitution.