Library · Noun reference
elevation
Surface elevation on a native raster grid.
Quick facts
| Fact | Value |
|---|---|
| Semantic type | Static continuous field |
| Units | m; native vertical reference |
| Source flavors | usgs_3dep |
| Access | Explicit bounded acquisition; optional offline snapshot replay |
Usage
from cubedynamics.data.three_dep import elevation

elevation(*, bbox, source='usgs_3dep', tile_id=None, snapshot_dir=None, offline=False)
The signature above is generated from the installed loader. Call acquisition before composing the analysis pipe.
Arguments
| Argument | Meaning | Default |
|---|---|---|
| bbox | WGS84 west, south, east, north; <=0.02° per side in CONUS. | required |
| source | Only usgs_3dep. | 'usgs_3dep' |
| tile_id | Optional exact ScienceBase version ID; otherwise require one Current-tagged tile. | None |
| snapshot_dir | Optional new directory to retain exact responses; use a new directory for a live refresh. | None |
| offline | Replay verified snapshots only; never download missing content. | False |
Available sources
| Source | Coverage | Resolution | Time |
|---|---|---|---|
| usgs_3dep | CONUS; one fully covering native tile | 1/3 arc-second; native cells | Static tile version, not a time series |
Returned data
An xarray.DataArray named elevation, with y, x native cell-center coordinates. North is up. There is no invented time axis. Attributes retain CRS, units, nodata, transform, tile metadata, query bounds, exact response provenance, and the interpretation contract.
Order / grammar behavior
Use v.mean over a spatial dimension, ordinary callables for explicit spatial transformations, and xarray maps. Temporal anomaly/event verbs require time and are not appropriate for this static surface.
Minimal reproducible example
Live acquisition below requires network access and the source's optional dependencies. The complete offline lesson uses checksum-verified real inputs and shows a plot at every step.
from cubedynamics.data.three_dep import elevation
import matplotlib.pyplot as plt

field = elevation(bbox=(-105.300, 39.985, -105.291, 39.994))
field.plot(cmap="terrain")
plt.show()
See the data
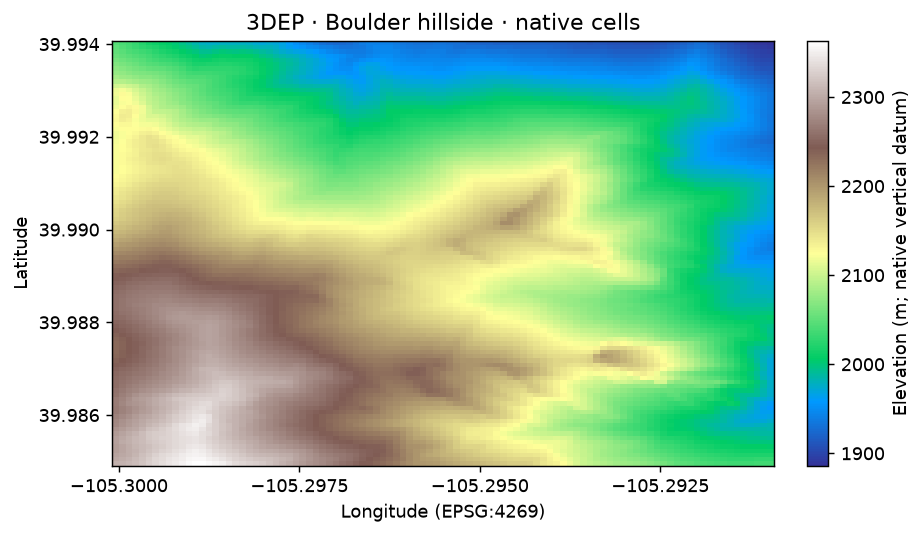
Code and interpretation · Figure and input hashes
Quality and provenance
Implemented and documented here as a scientific noun. Operational certification remains bounded: no production serving revision has been assigned. Retained real-data samples, numerical/schema checks, and replay tests are distinct from broad scientific suitability or live-service guarantees.
- usgs_3dep: 256 native pixels per side; 80 requests / 8 MB bodies / 180 s. No mosaics, resampling, silent tile clipping, or vertical conversion. Requires Rasterio >=1.4. A requested historical tile is not asserted current.
Validation evidence and release gates. No automatic source switching or synthetic substitution.