prism · methods and QA examples
Provider, product, coverage, units and source status have one canonical home: prism source reference. This page preserves the operational example, reviewed figure and source citations.
Quickstart
PRISM acquisition is currently daily. Use freq="D"; unsupported monthly
frequencies raise before network access rather than being silently aggregated.
Get the stream (CubeDynamics grammar)
import cubedynamics as cd
from cubedynamics import pipe, verbs as v

cube = cd.load_prism_cube(
    variable="ppt",
    start="2020-01-01",
    end="2020-02-01",
    bbox=[-105.4, 39.8, -105.0, 40.2],
    freq="D",
)

pipe(cube) | v.mean(over="time") | v.plot()
Customizing the view
pipe(cube) | v.plot(camera={"eye": {"x": 2.2, "y": 1.6, "z": 1.3}})
Reviewed source-QA plot
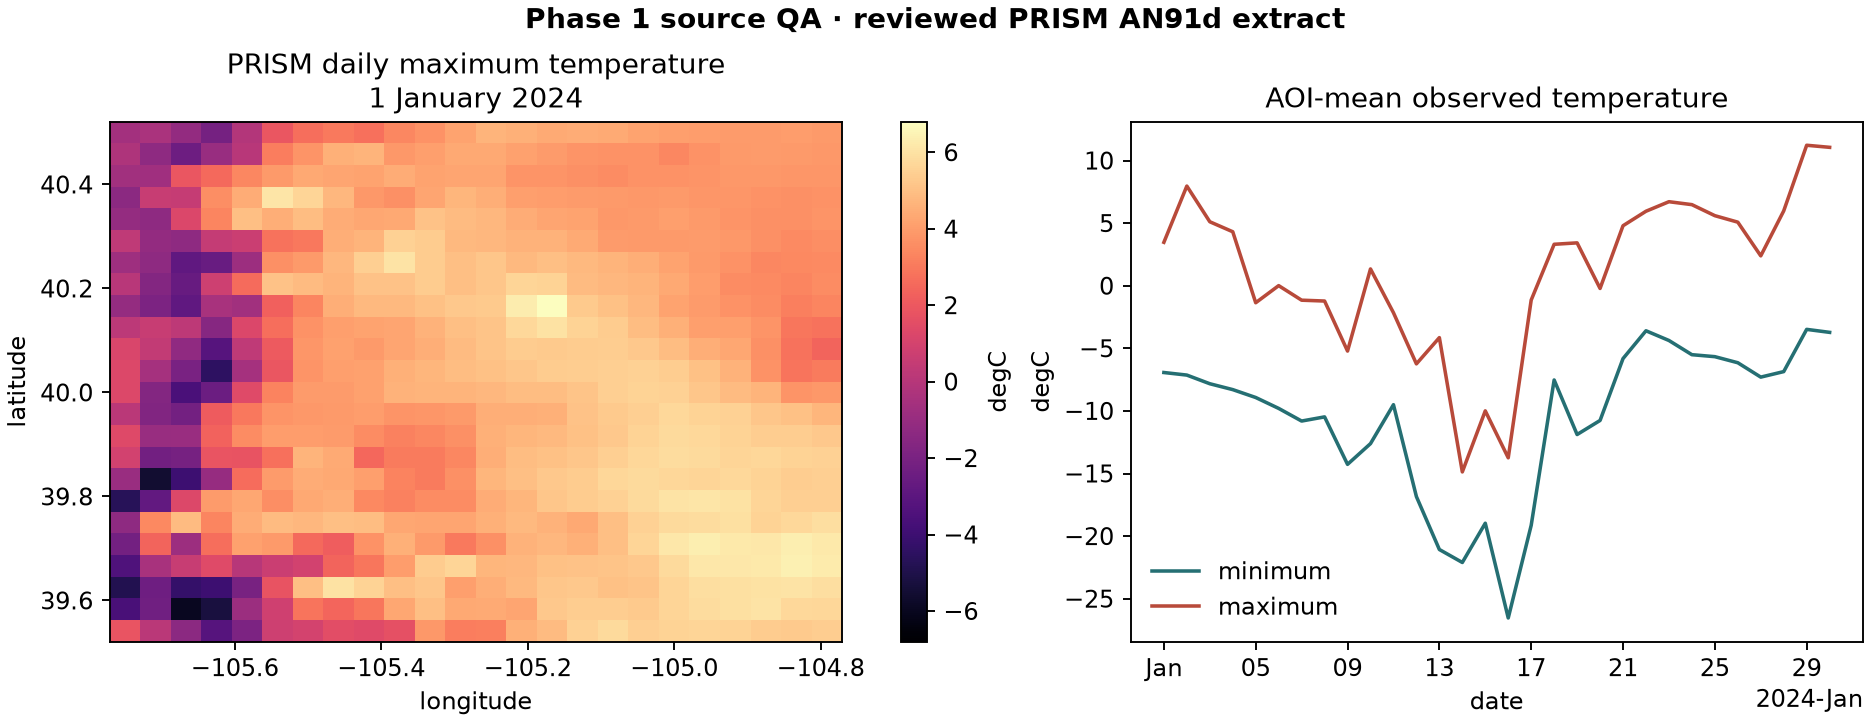
This is a checked-in rendering of a real, checksum-controlled PRISM extract, not synthetic example data. The accompanying QA checks provenance, CRS, time ordering, finite coverage, physical temperature bounds, minimum/maximum consistency, and overlap with the requested area of interest.
Reproduce the validation
Run the publication QA workflow from the repository root:
python scripts/run_source_qa.py
The command writes the figure and a machine-readable result to
artifacts/source_qa/. See the Phase 1 source-QA report
for the exact checks, evidence, and current limitations.
Citation
Daly, C., Halbleib, M., Smith, J. I., Gibson, W. P., Doggett, M. K., Taylor, G. H., Curtis, J., & Pasteris, P. P. (2008). Physiographically sensitive mapping of climatological temperature and precipitation across the conterminous United States. International Journal of Climatology, 28(15), 2031–2064. https://doi.org/10.1002/joc.1688
Back to Datasets Overview
Next recommended page: Which dataset should I use?