sentinel2 · methods and QA examples
Provider, product, coverage, units and source status have one canonical home: sentinel2 source reference. This page preserves the operational example, reviewed figure and source citations.
Quickstart
Get the stream (CubeDynamics grammar)
import cubedynamics as cd
from cubedynamics import pipe, verbs as v

cube = cd.ndvi(
    lat=40.0,
    lon=-105.25,
    start="2023-06-01",
    end="2023-07-01",
)

pipe(cube) | v.mean(over="time") | v.plot()
Preview plot
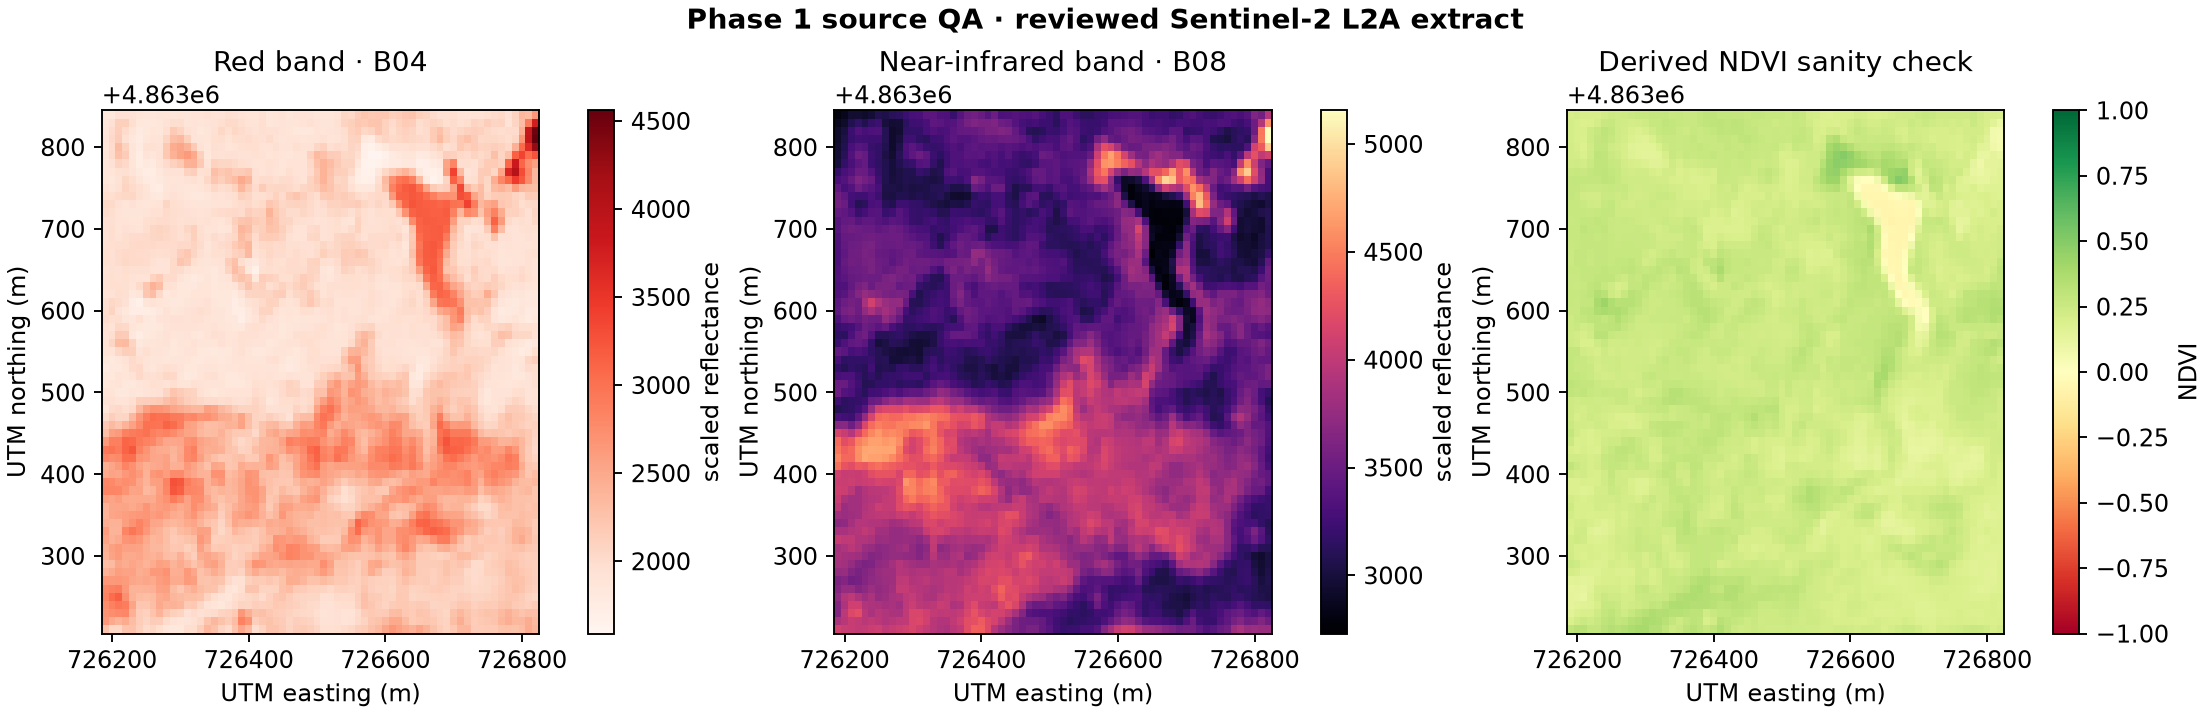
This reviewed observational extract shows the B04 red band, B08 near-infrared band, and the NDVI derived from them over a 640 m South Dakota window. The panels make orientation, spatial detail, value scale, and the index transformation inspectable.
Regenerate this plot
-
Rebuild the small observational fixtures when source review is required:
python python scripts/build_phase1_qa_fixtures.py -
Run
python scripts/run_source_qa.py. The offline workflow checks the checksum, source, CRS, bands, unique ordered acquisitions, 10 m grid, coordinate orientation, missingness, reflectance scale, and NDVI bounds.
See the complete Phase 1 source QA report.
Source documentation
See the Copernicus Sentinel-2 mission and Level-2A band documentation. The previous MODIS citation on this page described a different sensor and product and has been removed.
Back to Datasets Overview
Next recommended page: Which dataset should I use?