Home
Linking Food Web Theory with Global Data to Quantify Plankton Trophic Interactions
Welcome to the worldwideplankton repository, part of the third cohort of working groups within the Environmental Data Science Innovation and Inclusion Lab (ESIIL). This repository is the central hub for our working group, encompassing our project overview, project updates, team member information, and our developing codebase integrating the Zooplankton International Geospatial (ZIG) dataset of freshwater zooplankton to the Global Evaluation of Storms on freshwater Habitat and structure of phytoplankton Assemblages (GEISHA) dataset of freshwater phytoplankton.
As the working group progresses, the repository becomes the reproducible record of the science, and the website becomes the public report.
Edit this homepage in GitHub Open the GitHub repository
Our Task
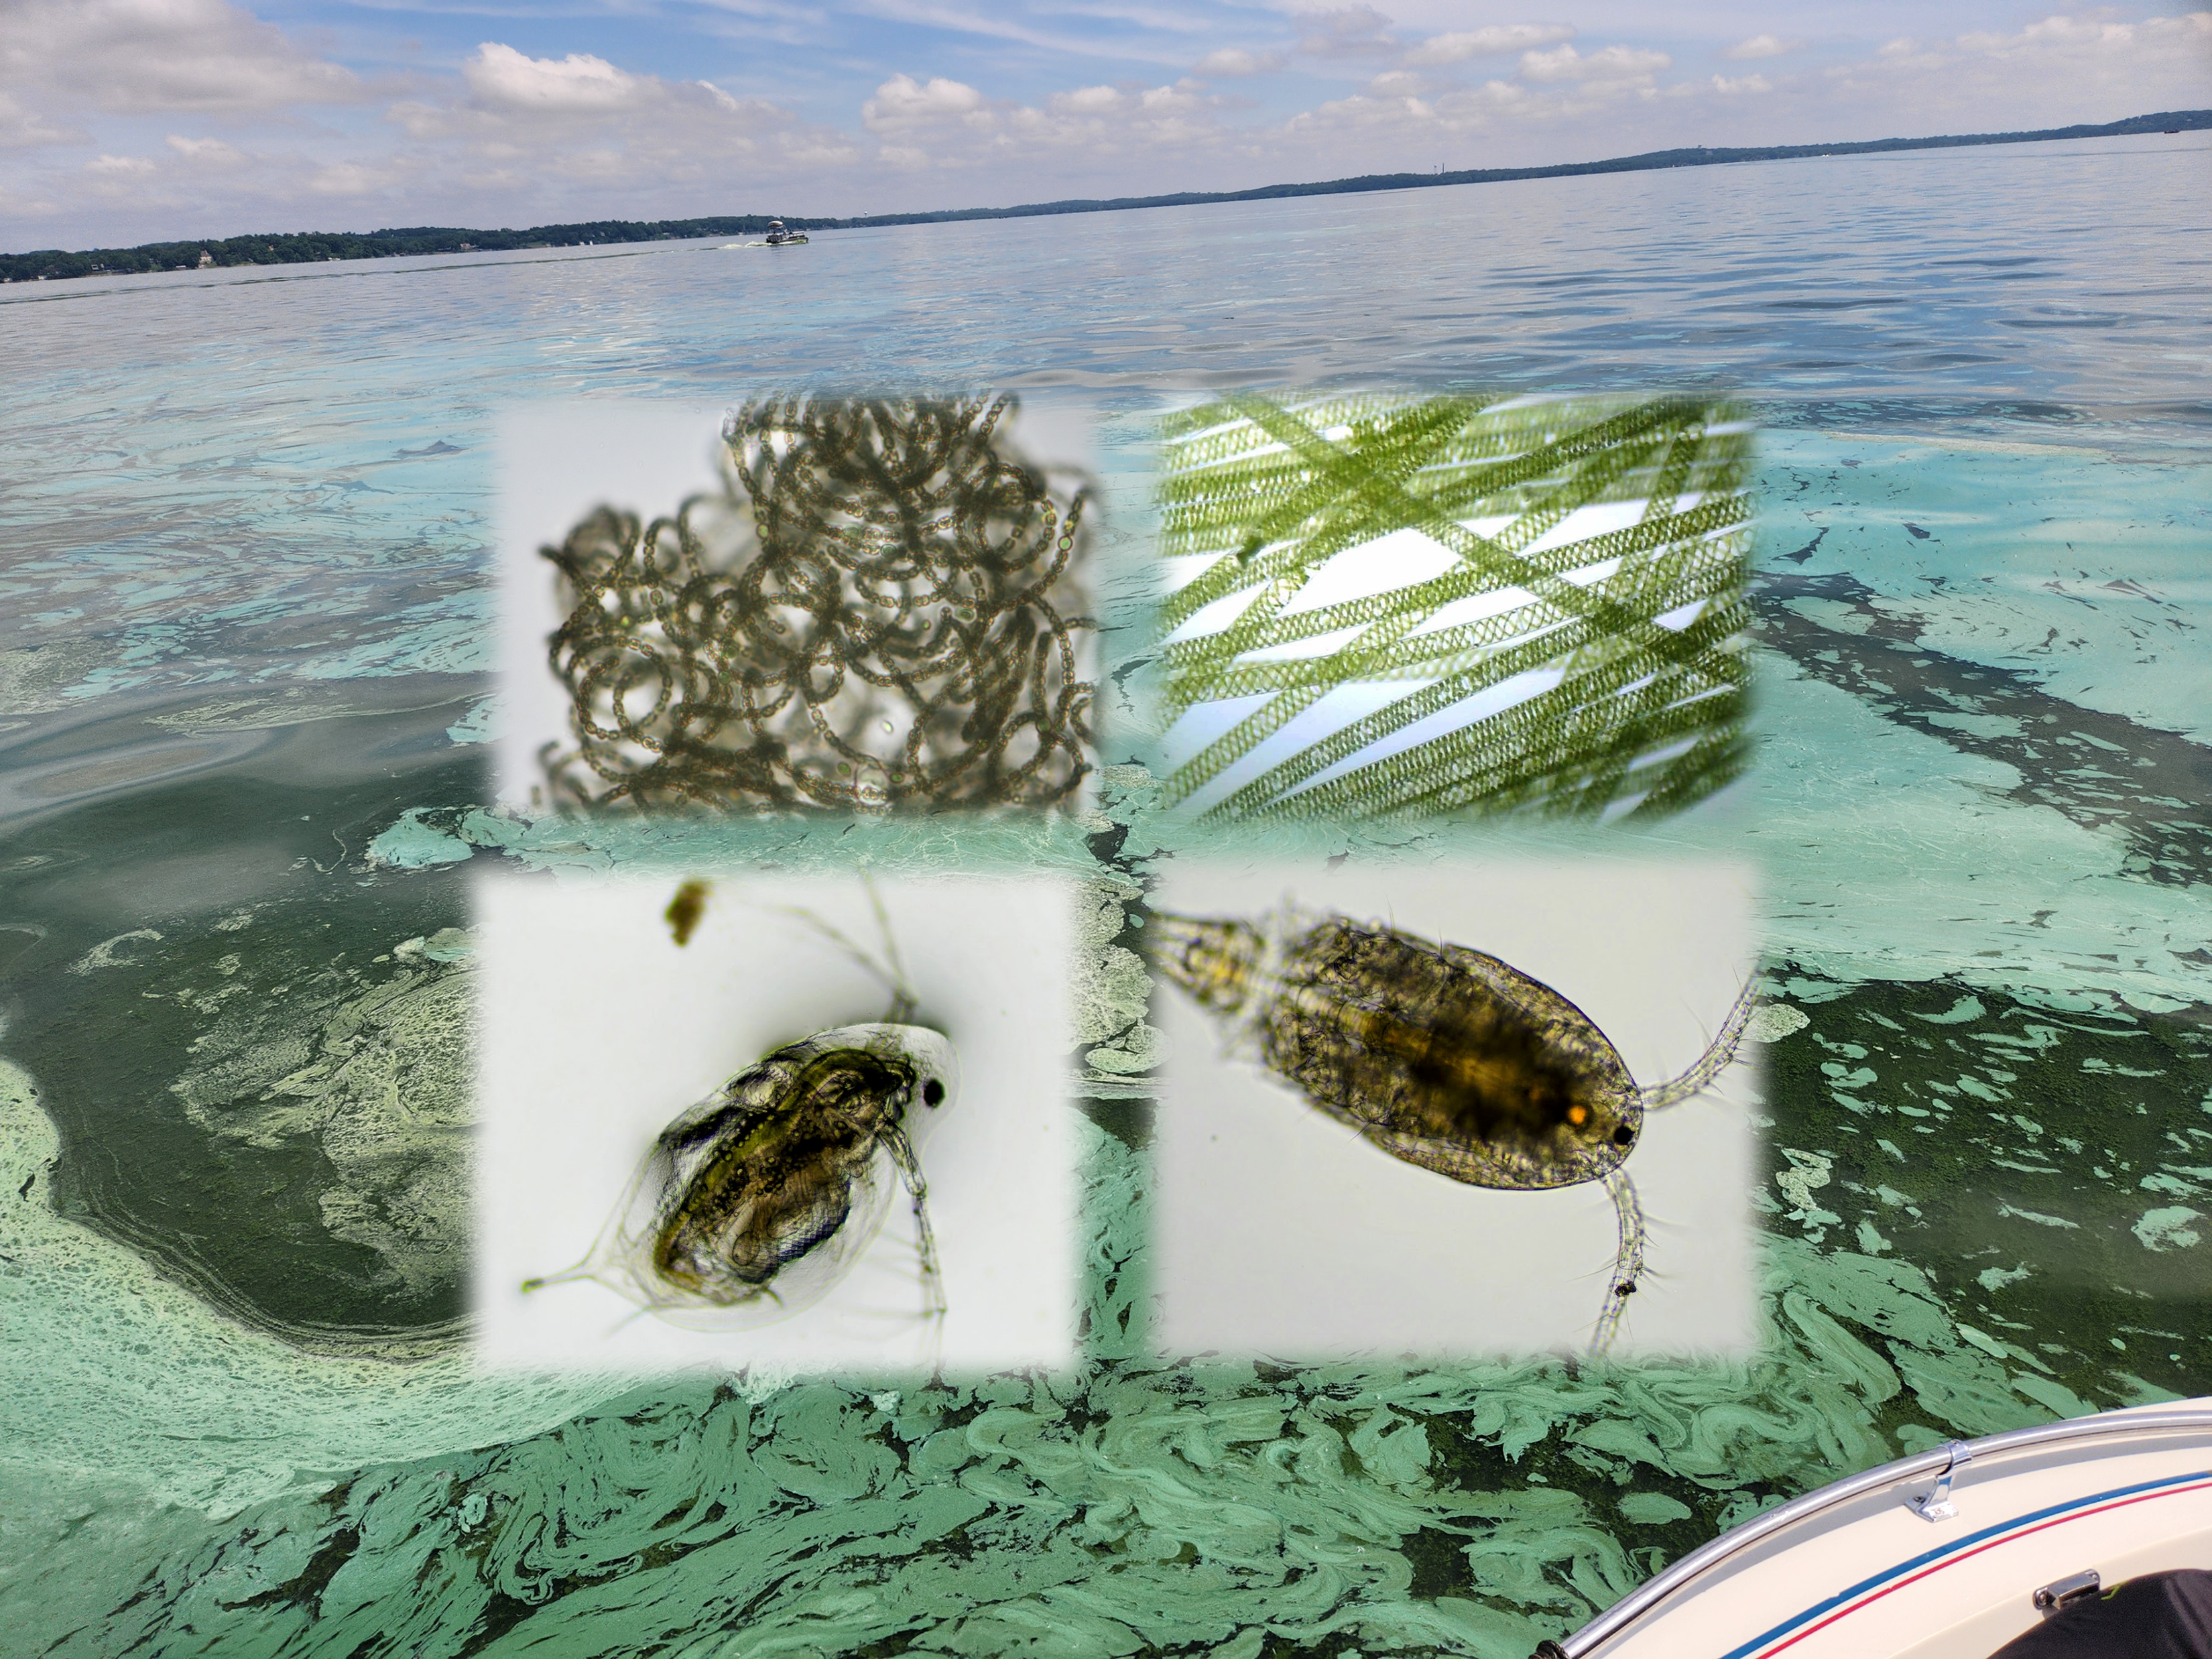
Freshwater ecosystems provide ecological, cultural, and economic benefits yet remain threatened by worldwide biodiversity loss and understudied compared to terrestrial and marine ecosystems. Furthermore, while zooplankton are key drivers of ecosystem function within lakes, providing food for fish to grow and grazing phytoplankton (i.e., algae) to manage water quality, important questions remain regarding zooplankton biodiversity response to global change and how these changes may influence zooplankton-algae trophic interactions. Changes in the diversity of zooplankton worldwide can lead to excess algal growth negatively impacting water quality, human health, tourism, and property values. Using the largest dataset of zooplankton freshwater biodiversity we will quantify the breadth of zooplankton thermal tolerances as well as their composition across different climate regimes worldwide. Then, by integrating this zooplankton dataset with the largest dataset of algal freshwater diversity we will address how trophic interactions have been changing over time and across the globe. We will accomplish both of these goals relying on new and established effective team science methods, drawing from the group’s diverse background and expertise, and share our results and data broadly.
Start Here
- Replace the title and summary with the working group question, the community or scientific need, and the main outputs the group expects to produce.
- Add or link the datasets, working documents, and references your group will use.
- Run or adapt at least one analysis workflow and record decisions in the repository.
- Commit figures, tables, notes, and summaries so the work is versioned and reproducible.
- Use the website to share progress, methods, and results with collaborators and community audiences.
Plan the work Document data and resources Set community expectations
Working Group Landmarks
Use these lightweight labels to connect work sessions, meeting notes, and homepage edits:
WG-A People and roles; WG-B Question and scope; WG-C Data and access; WG-D Methods and workflows; WG-E Results and synthesis; WG-F Outputs and handoff.
How This Repo Is Organized
The repository has two connected layers. Top-level files configure the project and its automation. The docs/ folder contains the website content. mkdocs.yml tells MkDocs how to turn that content into the public site. Analysis folders hold the working scientific materials that generate the results shown on the website.
| Part of the repo | What it does | What usually belongs there |
|---|---|---|
| Top-level files and folders | Configure the project and keep shared repository guidance in one place | README.md, LICENSE, workflows, containers, templates, environment setup, and repo-wide metadata |
docs/ |
Stores the source content for the public website | Homepage text, summaries, methods, community-facing documentation, and website assets |
mkdocs.yml |
Controls how the site is rendered | Navigation, theme settings, plugins, and GitHub edit links |
| Working folders | Hold the science-in-progress | Data references, notebooks, scripts, workflows, figures, outputs, and reproducibility materials |
Repository Side: Do the Science

This image represents the repository side of the working group: data, code, workflows, and reproducibility.
To update: delete the current image in this folder and upload one new square image. Use a flat, minimal, screen-print style graphic with no text.
Delete this note after the site is customized.
Related landmarks: WG-C Data and access; WG-D Methods and workflows.
The repository is the working record of the group: it tracks what changed, why it changed, and how results were produced.
- Data sources and metadata
- Notebooks and scripts
- Workflows and reproducible analysis
- Meeting notes and decisions
- Figures, tables, and other outputs
Website Side: Share the Science

This image represents the website side of the working group: summaries, maps, figures, and public communication.
To update: delete the current image in this folder and upload one new square image. Use a flat, minimal, screen-print style graphic with no text.
Delete this note after the site is customized.
Related landmarks: WG-E Results and synthesis; WG-F Outputs and handoff.
The website turns the working group record into a readable public report.
- Plain-language summaries
- Methods documentation
- Figures, maps, and visualizations
- Meeting outputs and synthesis products
- Manuscripts, reports, or educational materials
How the Two Sides Connect
The repository and website are not separate products. When the group updates data, analysis code, figures, or written summaries in GitHub, those changes can be rendered through the website. Commits are the bridge between doing the science and sharing the science.
When This Working Group Is Live
A working group is live when:
- The research question is stated
- Data sources are linked or documented
- At least one analysis or workflow is runnable
- Outputs are committed to the repository
- The website explains what the group is doing and why it matters
For guidance on turning this scaffold into a public scientific record, see the Public-Facing Site Guide.
Early Process Gallery
Use this section to show how the working group gets started without manually editing image links one by one.

This gallery displays early setup artifacts for the working group.
Add or replace files in this gallery
To update: upload supported files to this folder and commit. The website sorts files alphabetically. Use this folder for kickoff notes, orientation screenshots, starter diagrams, and early planning visuals.
Delete this note after the site is finalized.
Key Links to Replace
Use this section for the links your group will actually maintain. Replace each placeholder with the working document, repository resource, dataset hub, or output page that your collaborators should use.
- Main Working Document: [link]
- GitHub Repository: [link]
- Data / Resources: [link]
- Outputs / Dashboard: [link]
Current Phase
Working Phase: Preparing for Meeting 1
(Replace this line with the phase your group is actually in, such as working asynchronously, preparing outputs, or revising a manuscript.)
Team Members
Replace this table with names, roles, institutions, and responsibilities so new collaborators know who is doing what.
Related landmark: WG-A People and roles.

This image represents collaboration, team identity, or a real working group photo.
To update: delete the current image in this folder and upload one new image. A real group photo is welcome here, but an abstract collaboration image also works.
Delete this note after the site is customized.
| Person | Role | Institution | Expertise |
|---|---|---|---|
| Tyler Butts | PI | University of Minnesota - Twin Cities | Zooplankton, Food Webs, Time Series, Ecosystem Ecology |
| Michael Meyer | Co-PI | U.S. Geological Survey | Geography, Remote Sensing, Aquatic Ecology |
| Chase Rakowski | Co-PI | University of Colorado - Boulder | Food Webs, Predator-Prey Interactions |
| Stephanie Figary | Co-PI | University of Vermont | Community Ecology, Freshwater Ecology, Food Webs |
| Jason Stockwell | Co-PI | University of Vermont | Food Webs, Phytoplankton, Fish, Zooplankton, Team Science |
| Celia Symons | Co-PI | University of California-Irvine | Zooplankton, Community Ecology, Functional Diversity, Time Series |
| Rachel Pilla | Co-PI | Oak Ridge National Laboratory | Freshwater Ecology, Time Series, Statistical Modeling |
| Lorena Silva | Participant | University of Maryland | Zooplankton, Community Ecology, Machine Learning, Statistical Modeling |
| Anna Schmidt | Participant | University of Vermont | Statistical Modeling, Zooplankton |
| Eckhardt Karsten | Participant | University of California-Davis | Data Management, Statistical Modeling, Co-occurrence Modeling |
| Stephanie Hampton | Participant | University of California-Davis | Freshwater Ecology, Ecosystem Ecology, Zooplankton |
| Rosalie Bruel | Participant | OFB, DRAS, Service EcoAqua | Time Series, Multi-lake Analysis, Network Animation |
| Shin-Ichiro Matsuzaki | Participant | Natinoal Institute for Environmental Studies, Japan | Long-term monitoring, Species interactions, Food Web, Watershed Management |