Ghosh-Style Tail Association for Climate Synchrony
Use this recipe when two climate-synchrony series have similar ordinary correlation but may differ in the lower and upper tails. The plotting helper converts each series to normalized ranks, draws the diagonal tail bands used in Ghosh-style copula diagnostics, and annotates lower- and upper-band partial Spearman correlations.
from cubedynamics.plotting import plot_tail_association_triptych

fig = plot_tail_association_triptych(
    series_a,
    series_b,
    b=1 / 3,
    labels=("Location A", "Location B"),
    outpath="tail_association_climate_sync",
)
Passing outpath writes both tail_association_climate_sync.png and
tail_association_climate_sync.pdf.
From A Synchrony Cube
For a cube-like xarray.Dataset, use the extraction helper. Selectors must
reduce the cube to exactly one time series for each location, which keeps
spatial aggregation separate from plotting.
from cubedynamics.plotting import plot_tail_association_from_cube

fig = plot_tail_association_from_cube(
    ds,
    var="severity_synchrony",
    selector_a={"isel": {"y": 0, "x": 0}},
    selector_b={"isel": {"y": 2, "x": 3}},
    time_dim="time",
    preprocess="zscore",
    labels=("Pixel A", "Pixel B"),
    outpath="severity_tail_association",
)
Plain coordinate selectors are also accepted:
fig = plot_tail_association_from_cube(
    ds,
    var="severity_synchrony",
    selector_a={"y": 39.8, "x": -105.3},
    selector_b={"y": 40.1, "x": -104.9},
)
Available preprocessing modes are raw, anomaly, zscore, and rank_only.
The event_binary and event_intensity names are reserved until the event
threshold contract is wired into the synchrony pipeline.
Demonstration Figure
The offline example builds mirrored synthetic pairs: one has stronger lower-tail association and the other has stronger upper-tail association, while ordinary Pearson and Spearman correlations remain the same.
PYTHONPATH=src python examples/ghosh_tail_association_demo.py --output-dir docs/assets/figures
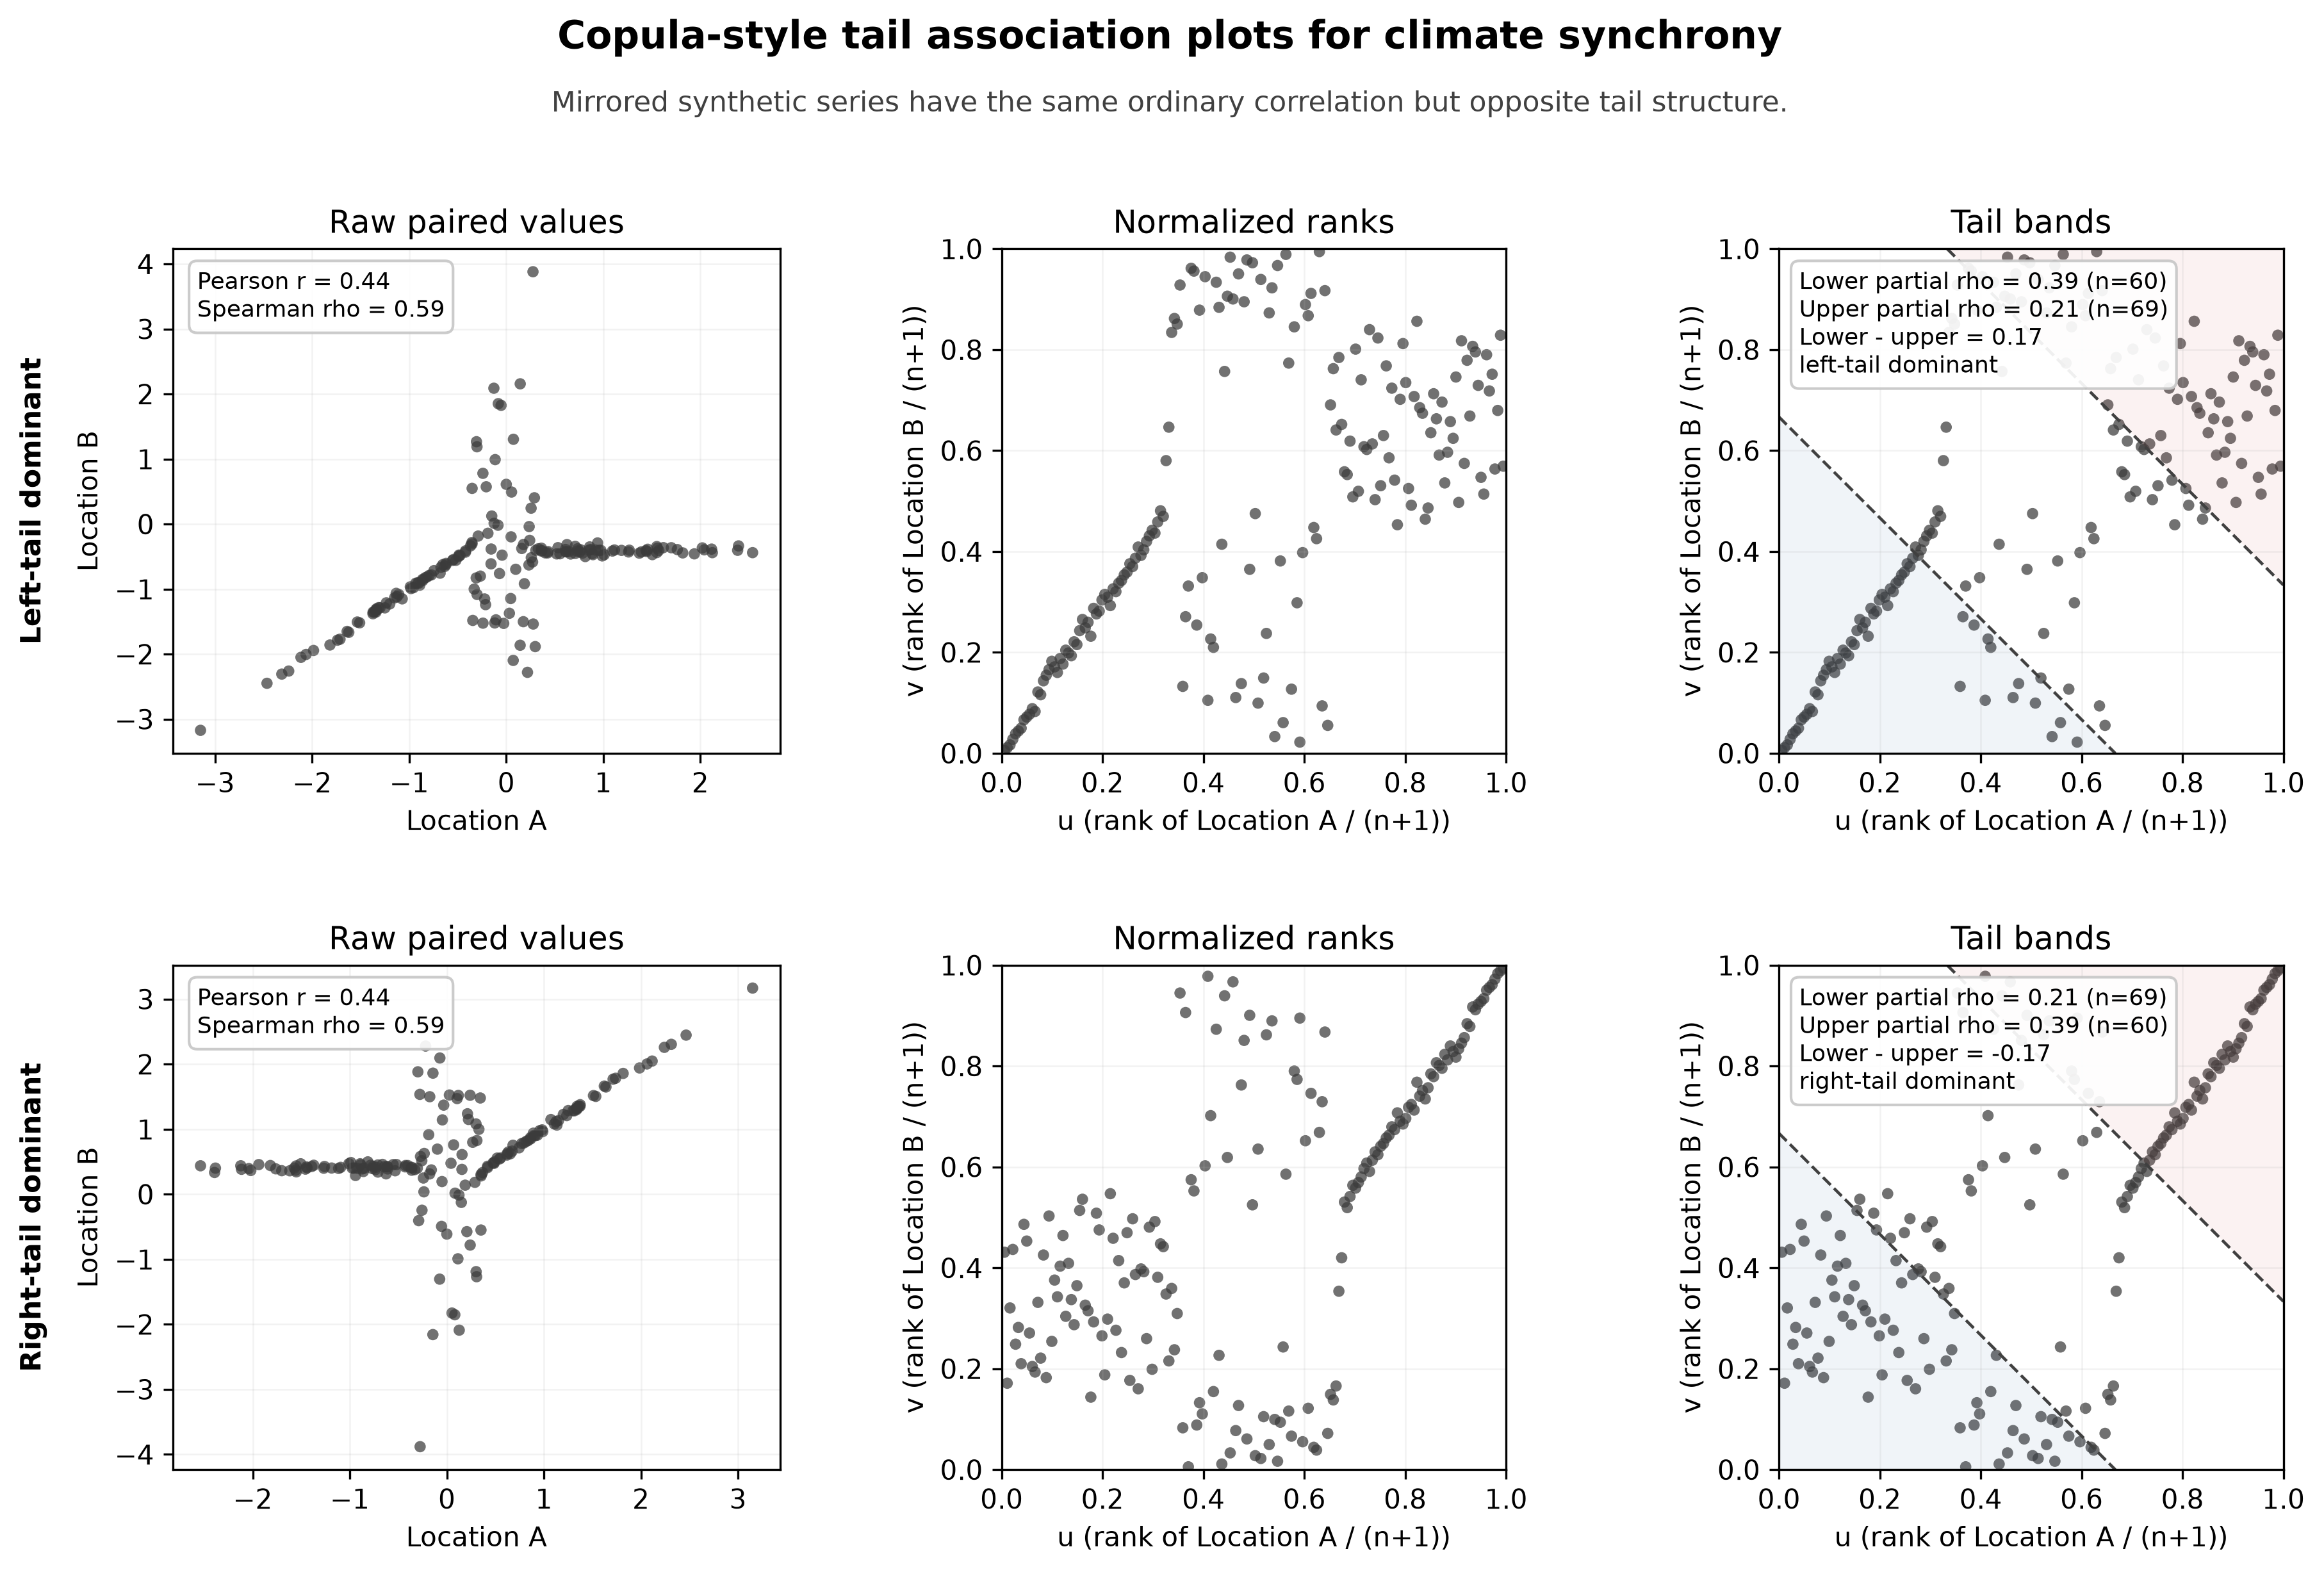
The figure is intended as a diagnostic, not a replacement for the synchrony estimator. Pearson and Spearman summarize the full paired relationship, while the lower and upper diagonal bands ask whether dependence is concentrated in cool/lower-event states, hot/upper-event states, or is approximately symmetric.