Why data cubes?
Cibele Amaral, ESIIL Remote Sensing Scientist 2023-11-02
Surviving in an ever-changing environment
"Environment, the complex of physical, chemical, and biotic factors that act upon an organism or an ecological community and ultimately determine its form and survival." (Encyclopedia Britannica)
How much can an organism resist and adapt to a new environmental condition? Photo credit: Cibele Amaral
1. Global warming
Yearly surface temperature compared to the 20th-century average from 1880–2022. Blue bars indicate cooler-than-average years; red bars show warmer-than-average years. NOAA Climate.gov graph, based on data from the National Centers for Environmental Information.
2. Extreme events and disturbances
Diseases, droughts, wildfires, and floods are examples of ecological disturbances that are increasing due to an unbalanced Earth system.
3. Projections
Projections indicate that the world is speeding towards a warmer climate and will experience more catastrophic extreme events.
"How can we use data science to help organisms (populations and communities) to adapt to a wild future?"
The era of revolutions and their integrated role in environmental sciences
1. Digital revolution: using cyberinfrastructure to collect, store, and process data & deliver information
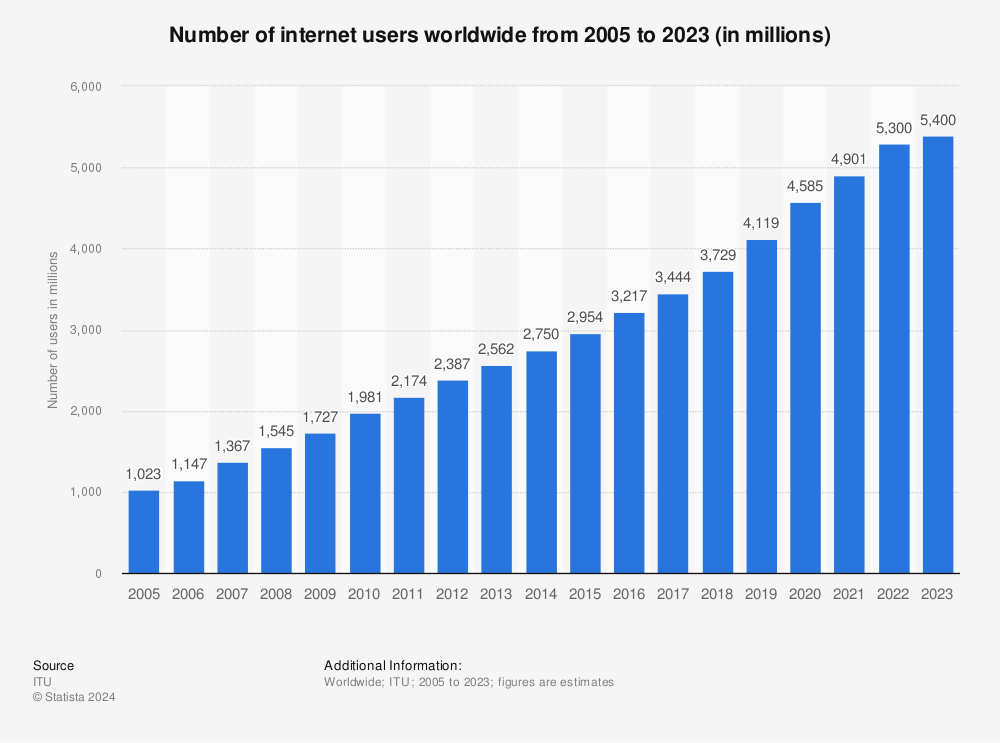
Find more statistics at Statista.
2. Big data revolution: using open socio-environment data collected across scales
Image credit: Kathy Bogan, Jennifer Balch, Chelsea Nagy.
Example of socio-enviromental data science: Hispanic, Asian, and Black and African American public school children attend schools with higher concentrations of air pollution than white students. Find more at An Unequal Air Pollution Burden at School.
3. Artificial Intelligence revolution: using state-of-the-art AI models to understand organism-environment interactions, predict responses under various scenarios, and manage ecosystems properly
AI models can help us to classify, cluster, forecast and identify outliers. They also provide us with data simulation and model emulation. Digital Twin representation, find more at Digital Twin Overview.
"But... why data cubes?"
Data cube is the arrangement of relevant data in an n-dimensional array to support analytics. Photo credit: x-array.
We need paired samples to create a model and wall-to-wall layers to map predictions.
1. Spatial data formats, referencing systems, and resolutions
Vectors (points, lines, polygons) and rasters (wall-to-wall, gridded layers) are format types of spatial data. Photo credit: EDX.
Sensors operate from different orbits and collect data with different Instantaneous Field Of View (IFOV). These parameters result in data layers with varying spatial resolution.
2. Cutting-edge tools to process data on the fly and create data cubes
- Clip to the Region of Interest (ROI)
- Filter dates, times
- Reproject to a standard Geographic Coordinate System (GCS) EPSG code
- Resample every layer to a standard spatial resolution
- Stack layers into a cube
Find more at gdalcubes
3. Cloud-optimized Geospatial Format
- Save the data (COG, zarr)
Cloud optimization enables efficient, on-the-fly access to geospatial data, offering several advantages such as reduced latency (1), scalability (2), flexibility (3), and cost-effectiveness (4). Find more at Cloud-Optimized Geospatial Formats Guide.