NEON carbon
Ty Tuff, ESIIL Data Scientist 2023-05-21
The National Ecological Observatory Network (NEON) is a significant resource in the field of ecology, providing open data from numerous sites across the United States. These datasets span multiple aspects of ecology, including the study of the carbon and nitrogen cycles, two crucial elements in ecosystem functioning.
NEON’s Carbon and Nitrogen (CN) data is particularly valuable for researchers interested in soil nutrient dynamics, ecosystem productivity, and nutrient cycling. This data provides measurements of soil carbon and nitrogen content, enhancing our understanding of soil health and fertility and how these key nutrients are cycled through ecosystems.
The neonUtilities package in R is a powerful tool that allows for easy access to NEON’s data, including the CN data. This package simplifies the process of downloading, exploring, and preparing NEON data for analysis. It includes functions to download data, stack data files from different months into a single table, and convert downloaded data into various formats, among other utilities.
By using the neonUtilities package, researchers can conveniently integrate NEON CN data into their R-based data analysis workflows. The functions provided in the package streamline the process of working with NEON data, saving time and effort in data cleaning and preparation, and allowing researchers to focus on their data analysis and interpretation.
In summary, the combination of NEON’s comprehensive CN data and the capabilities of the neonUtilities package provides a robust toolset for researchers studying soil nutrient dynamics and ecosystem functioning. Whether you’re an ecologist, environmental scientist, soil scientist, or a student in these fields, this resource can provide invaluable insights for your work.
library(neonUtilities)
library(ggplot2)
foliar <- loadByProduct(dpID="DP1.10026.001", site="all",
package="expanded", check.size=F,
token=my_token)
names(foliar)
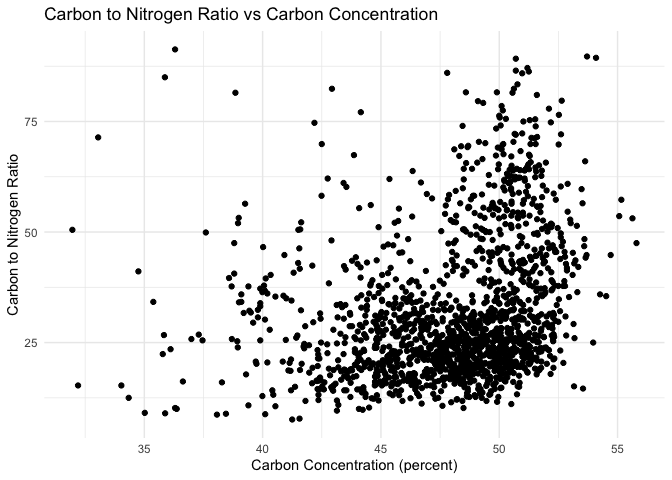
ggplot(foliar$cfc_carbonNitrogen, aes(x = carbonPercent, y = CNratio)) +
geom_point() +
labs(title = "Carbon to Nitrogen Ratio vs Carbon Concentration",
x = "Carbon Concentration (percent)",
y = "Carbon to Nitrogen Ratio") +
theme_minimal()
import os
import pandas as pd
import numpy as np
import matplotlib.pyplot as plt
from neon_api_tools.api_tools import neon_api_tools

# Set your NEON API token
my_token = "your_neon_api_token_here"

# Instantiate the API tools object
neon_tools = neon_api_tools()

# Download the NEON foliar data
foliar = neon_tools.loadByProduct(dpID="DP1.10026.001", site="all",
                                  package="expanded", check_size=False,
                                  token=my_token)

# Get the foliar dataframe
foliar_df = foliar['cfc_carbonNitrogen']

# Plot the carbon to nitrogen ratio against the carbon concentration
fig, ax = plt.subplots()
ax.scatter(foliar_df['carbonPercent'], foliar_df['CNratio'])
ax.set_xlabel("Carbon Concentration (percent)")
ax.set_ylabel("Carbon to Nitrogen Ratio")
ax.set_title("Carbon to Nitrogen Ratio vs Carbon Concentration")
plt.show()