NEON and LTER macroinverts powered by ecocomDP
Ty Tuff, ESIIL Data Scientist 2023-10-30
Introduction
In ecological synthesis projects, tasks related to finding, accessing,
and vetting datasets to include in an analysis often creates an enormous
time sink. However, it is crucial that investigators understand the
structure of and assumptions behind each of the datasets included in a
study. Here we present some tools available in the ecocomDP package
for R to facilitate this initial data discovery, wrangling, and vetting
process for datasets representing communities of organisms.
“ecocomDP” is both the name of an R package and a data model.
The ecocomDP data model is a “dataset design pattern for ecological
community data to facilitate synthesis and reuse”. Because this data
model is intended for use with community data, observations are expected
to be measures of species abundance, biomass, or similar. However, some
ecocomDP datasets report occurrences. The motivation for applying the
ecocomDP data pattern to both NEON biodiversity data products and EDI
data packages, including data from the US Long Term Ecological Research
(LTER) Network and Macrosystems Biology projects, is to make these data
discoverable and accessible through a single data search tool and to be
delivered in a standard format. Functions in the ecocomDP package
provide tools to manipulate and visualize ecocomDP formatted data
objects in R. We are also in the process of developing tools to easily
convert ecocomDP data packages to Darwin Core Archives (DwC-A, event
core) for submission
to GBIF to further facilitate NEON and LTER
data discovery.
For more information on ecocomDP, see the GitHub repo here:
https://github.com/EDIorg/ecocomDP.
In this tutorial, we will learn how to find and access ecological community datasets provided by the National Ecological Observatory Network (NEON) and the Environmental Data Initiative (EDI).
Find, download, and explore aquatic macroinvertebrate data from lakes
In this tutorial we will look at benthic macroinvertebrate counts from lakes across NEON and at the North Temperate Lakes (NTL) LTER site.
Load the required packages:
library(neonUtilities)
library(readr)
library(dplyr)
library(ggplot2)
library(ecocomDP)
Next, search the ecocomDP catalog for datasets that include the term “invertebrate”. If you explore the summary table, you will see benthic macroinvertebrate community data exist for NEON sites and the North Temperate Lakes (NTL) LTER site.
# search for invertebrate data packages
search_result <- search_data(text = "invertebrate")
print(search_result)

# We will work with the following two ecocomDP datasets:
# NEON aquatic macroinvertebrates package id is "neon.ecocomdp.20120.001.001"
# LTER NTL benthic macroinvertebrates package id is "edi.290.2"
Let’s take a look at the NEON site list to identify which NEON sites are lakes.
# download NEON site list
neon_sites <- read_csv("https://www.neonscience.org/sites/default/files/NEON_Field_Site_Metadata_20230309.csv")

# let's get a list of NEON sites that are lakes
neon_lakes <- neon_sites %>%
  filter(field_site_subtype == "Lake") %>%
  select(field_site_id) %>%
  unlist(use.names = FALSE)
Next, download the two datasets. Note that each data package is downloaded as a list of tables. Please see the ecocomDP github page for more information about the data model.
# download NEON macroinvert data from lakes
neon_data_list <- read_data(
  id = "neon.ecocomdp.20120.001.001",
  site = neon_lakes, # NEON sites
  check.size = FALSE)

# download LTER NTL macroinvert data
ntl_data_list <- read_data(id = "edi.290.2")
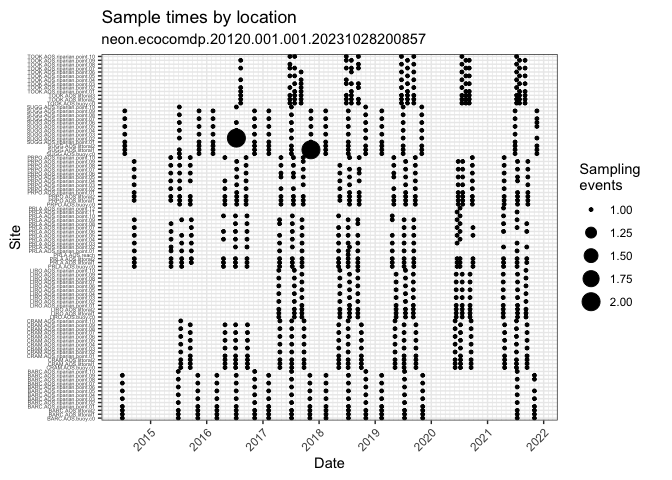
The ecocomDP pacakge includes some plotting functions to explore the
spatial, temporal, and taxonomic coverage of the datasets. First, take a
look at the spatial and temporal coverage of the NEON dataset.
# Explore the spatial and temporal coverage of the NEON dataset
neon_data_list %>% plot_sample_space_time()
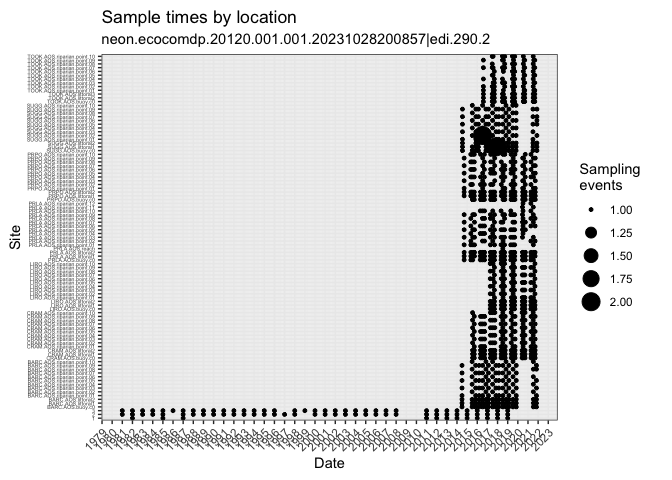
Rather than plotting each dataset separately, you can flatten, stack, and then plot the combined data.
# flatten the two datasets
flat_neon <- neon_data_list %>% flatten_data()
flat_ntl <- ntl_data_list %>% flatten_data()


# stack the two datasets
stacked_neon_ntl <- bind_rows(flat_neon, flat_ntl) %>%
  mutate(taxon_rank = tolower(taxon_rank)) # force lower case for all values

# plot spatial and temporal coverage of the two datasets
stacked_neon_ntl %>% plot_sample_space_time()
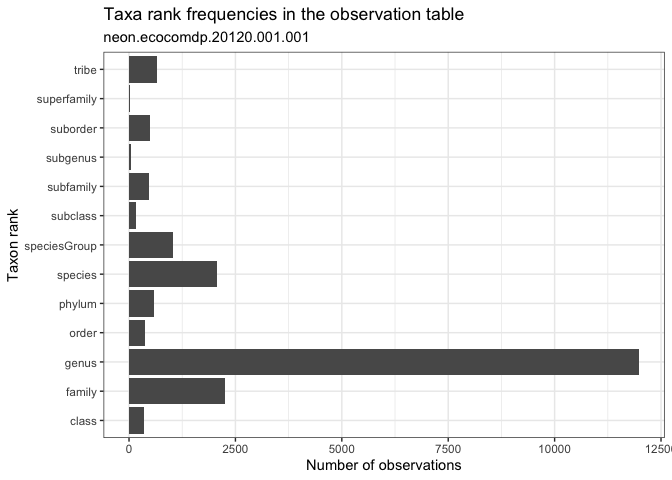
Next, check the taxonomic resolution reported in the two datasets. These datasets may not be compatible in a synthesis analysis if they aggregate their counts at different taxonomic resolutions - e.g., if one study reports counts for order, and another reports counts for species.
You can plot one dataset at a time:
# Explore the taxonomic resolution in the dataset.
# What is the most common taxonomic resolution (rank)
# for macroinvertebrate identifications in this dataset?
neon_data_list %>% plot_taxa_rank()
Or plot the stacked datasets:
stacked_neon_ntl %>%
  plot_taxa_rank(
    facet_var = "package_id",
    facet_scales = "free_x")
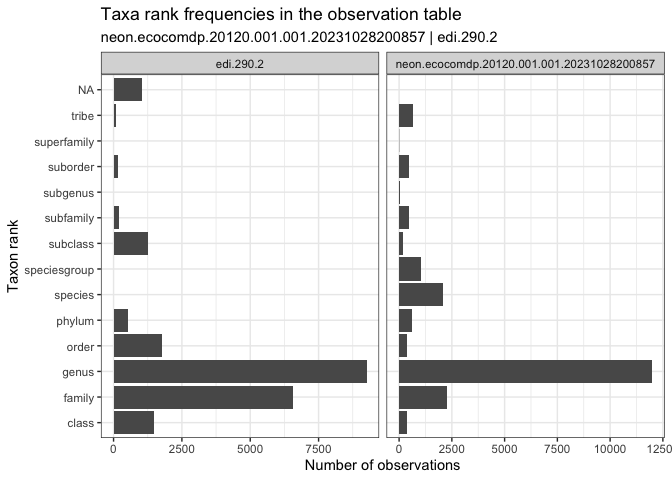
Similar taxonomic resolutions suggests these datasets may be compatible in a synthesis study.