EPA’s Water Quality Data Portal
Ty Tuff, ESIIL Data Scientist 2023-10-30
The U.S. Environmental Protection Agency’s (EPA) Water Quality Data Portal is a comprehensive repository of water quality monitoring data gathered from a broad spectrum of sources. It aggregates information from federal, state, tribal, and local organizations, and presents a wide array of parameters indicative of the health and status of various water bodies.
The data spans parameters such as temperature, pH, dissolved oxygen, along with details about specific chemicals and pollutants, offering a nuanced and comprehensive insight into water quality across multiple regions. This information is gleaned from several notable databases, including the Water Quality Exchange (WQX), the Storage and Retrieval (STORET) Data Warehouse, among other trusted sources.
One of the primary uses of the data accessible through the portal is to identify sources of pollution and assess the effectiveness of various water quality management programs. It offers crucial insights that help in understanding the health of aquatic ecosystems, tracking changes over time, and identifying trends or anomalies that might need immediate attention.
A particularly noteworthy feature of the Water Quality Data Portal is its search functionality. Users can search and download data specific to certain water bodies or geographic locations, tailoring the information to their specific requirements. This makes the portal an invaluable resource for stakeholders interested in water quality analysis and research.
Whether you’re an environmental scientist, a policymaker, a water management professional, or simply someone with a keen interest in understanding the quality of water in your region, the EPA’s Water Quality Data Portal is an unparalleled resource that brings a wealth of data right at your fingertips.
R
To download and visualize data using R, you can use the httr, xml2, tidyverse, and ggplot2 packages. First, install them if you haven’t already:
R code:
install.packages("httr")
install.packages("xml2")
install.packages("tidyverse")
install.packages("ggplot2")
Now you can use the following R script to download the data and create a plot:
R code:
library(httr)
library(xml2)
library(tidyverse)
library(ggplot2)
# Parameters for the query
state_code <- "US:42" # State code for Pennsylvania
characteristic_name <- "Ammonia" # Water quality characteristic
url <- paste0("https://www.waterqualitydata.us/Result/search?statecode=", state_code, "&characteristicName=", characteristic_name, "&mimeType=csv&zip=yes")
response <- GET(url)
if (status_code(response) == 200) {
data_file <- "water_quality_data.zip"
writeBin(content(response, "raw"), data_file)
cat("Data downloaded successfully.\n")
# Unzip the file and read the CSV
temp_dir <- tempdir()
unzip(data_file, exdir = temp_dir)
csv_file <- list.files(temp_dir, pattern = "*.csv", full.names = TRUE)[1]
water_quality_data <- read_csv(csv_file)
# Plot the data
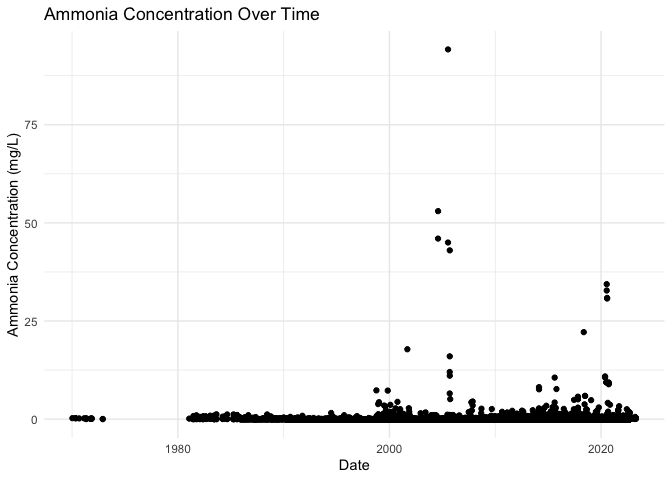
ggplot(water_quality_data, aes(x = ActivityStartDate, y = ResultMeasureValue)) +
geom_point() +
labs(title = "Ammonia Concentration Over Time",
x = "Date",
y = "Ammonia Concentration (mg/L)") +
theme_minimal()
} else {
cat(paste("Error:", status_code(response)), "\n")
}
Python code:
import requests
import pandas as pd
import matplotlib.pyplot as plt
import tempfile
import os
import zipfile

# Parameters for the query
state_code = "US:42" # State code for Pennsylvania
characteristic_name = "Ammonia" # Water quality characteristic

url = f"https://www.waterqualitydata.us/Result/search?statecode={state_code}&characteristicName={characteristic_name}&mimeType=csv&zip=yes"

response = requests.get(url)

if response.status_code == 200:
    data_file = "water_quality_data.zip"
    with open(data_file, "wb") as f:
        f.write(response.content)
    print("Data downloaded successfully.")

    # Unzip the file and read the CSV
    with tempfile.TemporaryDirectory() as temp_dir:
        with zipfile.ZipFile(data_file, 'r') as zip_ref:
            zip_ref.extractall(temp_dir)
        csv_file = [os.path.join(temp_dir, f) for f in os.listdir(temp_dir) if f.endswith('.csv')][0]
        water_quality_data = pd.read_csv(csv_file)

    # Plot the data
    water_quality_data['ActivityStartDate'] = pd.to_datetime(water_quality_data['ActivityStartDate'])
    plt.plot(water_quality_data['ActivityStartDate'], water_quality_data['ResultMeasureValue'], marker='o', linestyle='', markersize=2)
    plt.title("Ammonia Concentration Over Time")
    plt.xlabel("Date")
    plt.ylabel("Ammonia Concentration (mg/L)")
    plt.show()

else:
    print(f"Error: {response.status_code}")