USGS Water Services
Ty Tuff, ESIIL Data Scientist 2023-10-30
The United States Geological Survey (USGS) delivers a suite of robust and comprehensive APIs to facilitate the exploration and analysis of water data. Offering real-time and historical information on parameters such as streamflow, groundwater levels, and water quality measurements, these APIs are critical for a wide array of stakeholders, including researchers, policymakers, environmentalists, and many others.
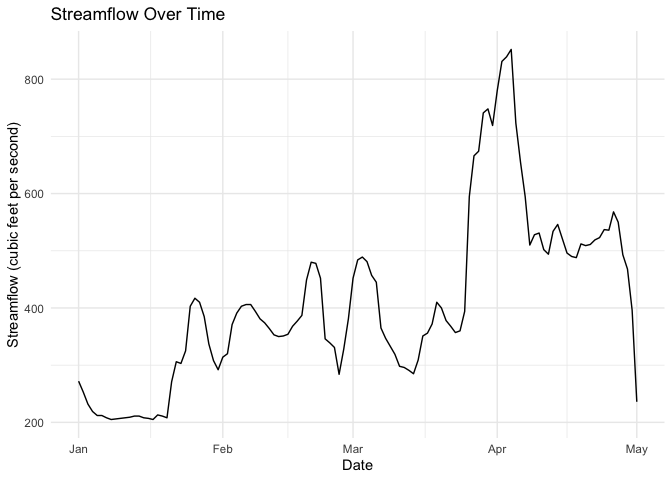
In the upcoming example, we will tap into this invaluable resource, specifically focusing on real-time streamflow data for a designated site. By accessing the USGS APIs, we will retrieve and subsequently chart the streamflow data, offering a clear, visual representation of this critical water measurement.
This exercise serves as not only a practical guide to interacting with USGS water data APIs but also as an introduction to the vast possibilities these data sources present. Whether it’s tracking environmental changes, informing water policy, or guiding scientific research, the data accessible through the USGS APIs provides an indispensable foundation for a multitude of analyses.
R Code:
# Load the required libraries
library(dataRetrieval)
library(ggplot2)

# Define the USGS site number for a specific location
site <- "06759500" # Changed to a different site number

# Define the parameter code for streamflow
parameterCd <- "00060"

# Specify the start and end dates for data retrieval
startDate <- "2023-01-01"
endDate <- "2023-05-01"

# Retrieve daily streamflow data for the specified site and date range
data <- readNWISdv(siteNumbers = site, parameterCd = parameterCd, startDate = startDate, endDate = endDate)

if (nrow(data) > 0) {
  # Convert the data to a data frame
  df <- data.frame(Date = as.Date(data$Date),
                   Streamflow = data$X_00060_00003)

  # Plot the data
  ggplot(df, aes(x = Date, y = Streamflow)) +
    geom_line() +
    theme_minimal() +
    labs(title = "Streamflow Over Time",
         x = "Date",
         y = "Streamflow (cubic feet per second)")
} else {
  cat("No data available for the specified site and date range.\n")
}
import requests
import pandas as pd
import matplotlib.pyplot as plt
from datetime import datetime
# Define the USGS site number for a specific location
site = "06759500" # Changed to a different site number
# Define the parameter code for streamflow
parameterCd = "00060"
# Specify the start and end dates for data retrieval
startDate = "2023-01-01"
endDate = "2023-05-01"
# Build the URL
url = f"https://waterservices.usgs.gov/nwis/dv/?format=json&sites={site}&startDT={startDate}&endDT={endDate}¶meterCd={parameterCd}"
# Send the request
response = requests.get(url)
# Parse the JSON response
data = response.json()
# Extract the time series data
time_series = data["value"]["timeSeries"]
# Check if there is data
if time_series:
# Extract the values and dates
values = [
float(item["value"]) for item in time_series[0]["values"][0]["value"]
]
dates = [
datetime.strptime(item["dateTime"], "%Y-%m-%dT%H:%M:%S.%f")
for item in time_series[0]["values"][0]["value"]
]
# Create a data frame
df = pd.DataFrame({"Date": dates, "Streamflow": values})
# Plot the data
df.plot(x="Date", y="Streamflow")
plt.title("Streamflow Over Time")
plt.ylabel("Streamflow (cubic feet per second)")
plt.grid(True)
plt.show()
