Open Street Map vectors
Ty Tuff, ESIIL Data Scientist 2023-05-21
OpenStreetMap (OSM) is a free, editable map of the world, created and maintained by volunteers worldwide. It provides data about roads, trails, points of interests, buildings, and much more, all across the globe. OpenStreetMap’s open-license data can be used for various purposes, from basic route planning to complex scientific analysis, urban planning, disaster management, and more.
To harness this wealth of data, several packages have been developed for different programming languages. In R, there’s the osmdata package, and for Python, there’s the OSMnx package.
The osmdata package in R allows users to access OpenStreetMap’s rich data directly from within R. With osmdata, users can search for and download specific types of data, such as features within a particular geographic area, or data tagged with specific keywords. The resulting data can then be processed and analyzed using R’s powerful data manipulation and statistical analysis functions.
Similarly, the OSMnx package is a Python library that lets users download data from OpenStreetMap and model, project, visualize, and analyze real-world street networks and any other geospatial geometries. It is particularly powerful for automated downloading and constructing of street networks (e.g., drive, walk, bike networks), but it also has capabilities for points of interest and building footprints, among other geospatial data.
With OSMnx, users can easily create network graphs from the street networks, compute network metrics, perform network routing, and visualize the networks and other spatial data with ease. OSMnx is built on top of GeoPandas, NetworkX, and matplotlib, and it integrates well with the scientific Python stack (numpy, scipy, pandas, etc.)
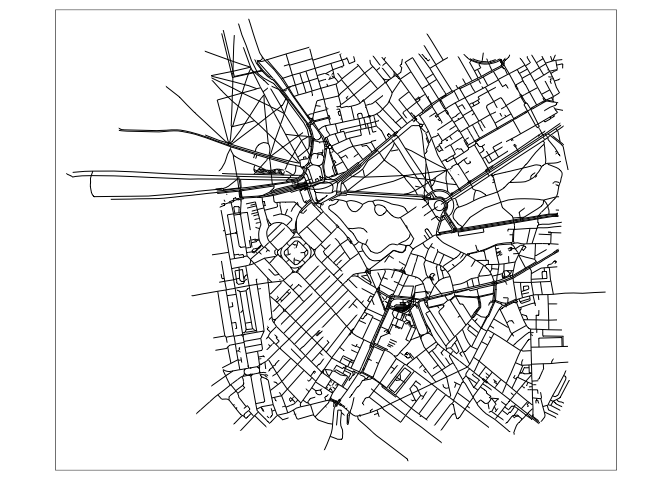
Both the osmdata package in R and the OSMnx package in Python provide powerful tools to access, analyze, and visualize the wealth of geographic data available from OpenStreetMap, catering to the needs of geographers, urban planners, social scientists, data scientists, or anyone interested in spatial analysis. ## Basic streetmap from Open Street Map R Code:
# Load the "osmdata" package for mapping
library(osmdata)
Data (c) OpenStreetMap contributors, ODbL 1.0. https://www.openstreetmap.org/copyright
library(tmap)
The legacy packages maptools, rgdal, and rgeos, underpinning the sp package,
which was just loaded, will retire in October 2023.
Please refer to R-spatial evolution reports for details, especially
https://r-spatial.org/r/2023/05/15/evolution4.html.
It may be desirable to make the sf package available;
package maintainers should consider adding sf to Suggests:.
The sp package is now running under evolution status 2
     (status 2 uses the sf package in place of rgdal)

Breaking News: tmap 3.x is retiring. Please test v4, e.g. with
remotes::install_github('r-tmap/tmap')
# Define the map location and zoom level
bbox <- c(left = -0.16, bottom = 51.49, right = -0.13, top = 51.51)

# Get the OpenStreetMap data
osm_data <- opq(bbox) %>%
  add_osm_feature(key = "highway") %>%
  osmdata_sf()

# Plot the map using tmap
tm_shape(osm_data$osm_lines) +
  tm_lines()
Python code:
# Load the "osmnx" package for mapping
import osmnx as ox

# Define the map location and zoom level
bbox = (51.49, -0.16, 51.51, -0.13)

# Get the OpenStreetMap data
osm_data = ox.graph_from_bbox(north=bbox[2], south=bbox[0], east=bbox[3], west=bbox[1], network_type='all')

# Plot the map using osmnx
ox.plot_graph(osm_data)

In both cases, we define the map location and zoom level, retrieve the OpenStreetMap data using the specified bounding box, and plot the map.
The main differences between the two approaches are:
Package names and syntax: In R, we use the osmdata package and its syntax to download and process the OpenStreetMap data, while in Python, we use the osmnx package and its syntax. Mapping libraries: In R, we use the tmap package to create a static map of the OpenStreetMap data, while in Python, we use the built-in ox.plot_graph function from the osmnx package to plot the map.