HydroBASINS
Ty Tuff, ESIIL Data Scientist 2023-10-27
Lehner, B., Grill G. (2013). Global river hydrography and network routing: baseline data and new approaches to study the world’s large river systems. Hydrological Processes, 27(15): 2171–2186. https://doi.org/10.1002/hyp.9740
https://www.hydrosheds.org/products/hydrobasins
library(dplyr)
Attaching package: 'dplyr'

The following objects are masked from 'package:stats':

    filter, lag

The following objects are masked from 'package:base':

    intersect, setdiff, setequal, union
library(sf)
Linking to GEOS 3.11.0, GDAL 3.5.3, PROJ 9.1.0; sf_use_s2() is TRUE
library(terra)
terra 1.7.39
library(tidyterra)
Attaching package: 'tidyterra'

The following object is masked from 'package:stats':

    filter
library(glue)
Attaching package: 'glue'

The following object is masked from 'package:terra':

    trim
library(ggplot2)
library(ggthemes)
library(stars)
Loading required package: abind
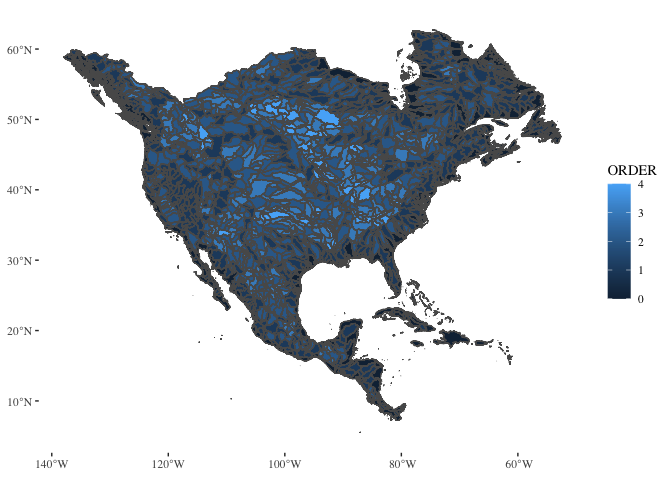
flood_polygon_data <- glue("/vsizip/vsicurl/https://data.hydrosheds.org/file/HydroBASINS/standard/hybas_na_lev06_v1c.zip") %>%
  vect() %>%
  st_as_sf(coords = c("lon","lat"))

flood_polygon_data
Simple feature collection with 2043 features and 13 fields
Geometry type: GEOMETRY
Dimension:     XY
Bounding box:  xmin: -137.9625 ymin: 5.495833 xmax: -52.61605 ymax: 62.74232
Geodetic CRS:  WGS 84
First 10 features:
      HYBAS_ID NEXT_DOWN   NEXT_SINK    MAIN_BAS DIST_SINK DIST_MAIN SUB_AREA
1  -1529934582         0 -1529934582 -1529934582         0         0   5285.0
2  -1529934352         0 -1529934352 -1529934352         0         0   3963.9
3  -1529934342         0 -1529934342 -1529934342         0         0  25440.1
4  -1529933372         0 -1529933372 -1529933372         0         0   5014.5
5  -1529933362         0 -1529933362 -1529933362         0         0  10703.8
6  -1529932942         0 -1529932942 -1529932942         0         0   3269.3
7  -1529932932         0 -1529932932 -1529932932         0         0  11559.6
8  -1529932252         0 -1529932252 -1529932252         0         0   3698.1
9  -1529932242         0 -1529932242 -1529932242         0         0   2494.1
10 -1529932192         0 -1529932192 -1529932192         0         0   8088.1
   UP_AREA PFAF_ID ENDO COAST ORDER SORT                       geometry
1   5285.0  771111    0     1     0    1 MULTIPOLYGON (((-79.51389 8...
2   3963.9  771112    0     0     1    2 POLYGON ((-81.02917 8.19166...
3  25440.1  771113    0     1     0    3 MULTIPOLYGON (((-81.75972 8...
4   5014.6  771114    0     0     1    4 POLYGON ((-83.61667 9.55833...
5  10703.8  771115    0     1     0    5 POLYGON ((-84.64167 9.7875,...
6   3269.7  771116    0     0     1    6 POLYGON ((-85.60833 10.8458...
7  11559.6  771117    0     1     0    7 MULTIPOLYGON (((-84.95972 9...
8   3698.3  771118    0     0     1    8 POLYGON ((-87.27917 12.8125...
9   2494.1  771119    0     1     0    9 POLYGON ((-87.05 13.24167, ...
10  8088.1  771120    0     0     1   10 POLYGON ((-86.57083 13.7875...
ggplot(data=flood_polygon_data, aes(fill=ORDER)) +
  geom_sf() +
  theme_tufte()
https://figshare.com/ndownloader/files/20087237
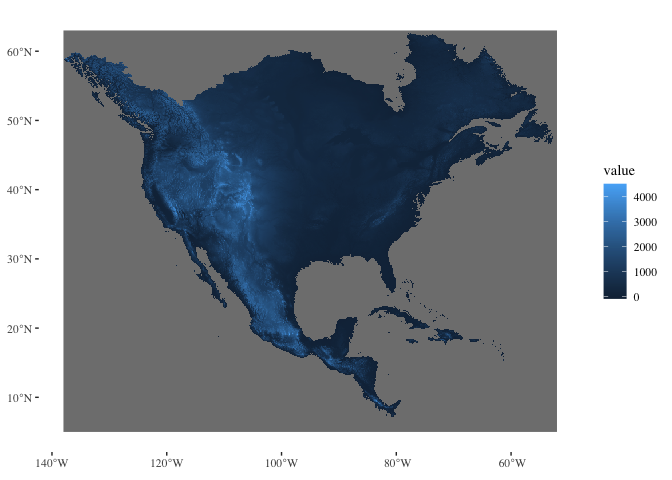
flood_polygon_data <- glue("/vsizip/vsicurl/https://data.hydrosheds.org/file/hydrosheds-v1-dem/hyd_na_dem_15s.zip/hyd_na_dem_15s.tif") %>%
  rast() #%>%
  #st_as_sf(coords = c("lon","lat"))

flood_polygon_data
class       : SpatRaster
dimensions  : 13920, 20640, 1  (nrow, ncol, nlyr)
resolution  : 0.004166667, 0.004166667  (x, y)
extent      : -138, -52, 5, 63  (xmin, xmax, ymin, ymax)
coord. ref. : lon/lat WGS 84 (EPSG:4326)
source      : hyd_na_dem_15s.tif
name        : Band_1
ggplot() +
  geom_spatraster(data=flood_polygon_data) +
  theme_tufte()
SpatRaster resampled to ncells = 500822
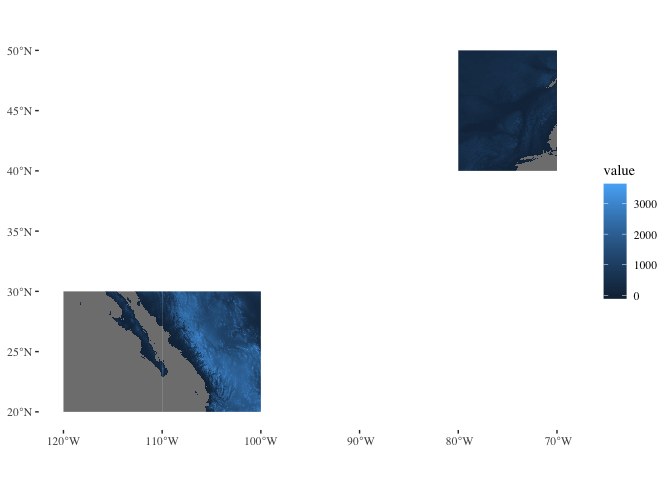
flood_polygon_data <- glue("/vsizip/vsicurl/https://data.hydrosheds.org/file/hydrosheds-v1-con/na_con_3s/n20w110_con.zip/n20w110_con.tif") %>%
  rast() #%>%
  #st_as_sf(coords = c("lon","lat"))

flood_polygon_data
class       : SpatRaster
dimensions  : 12000, 12000, 1  (nrow, ncol, nlyr)
resolution  : 0.0008333333, 0.0008333333  (x, y)
extent      : -110, -100, 20, 30  (xmin, xmax, ymin, ymax)
coord. ref. : lon/lat WGS 84 (EPSG:4326)
source      : n20w110_con.tif
name        : n25w105_con
flood_polygon_data2 <- glue("/vsizip/vsicurl/https://data.hydrosheds.org/file/hydrosheds-v1-con/na_con_3s/n20w120_con.zip/n20w120_con.tif") %>%
  rast() #%>%
  #st_as_sf(coords = c("lon","lat"))

flood_polygon_data2
class       : SpatRaster
dimensions  : 12000, 12000, 1  (nrow, ncol, nlyr)
resolution  : 0.0008333333, 0.0008333333  (x, y)
extent      : -120, -110, 20, 30  (xmin, xmax, ymin, ymax)
coord. ref. : lon/lat WGS 84 (EPSG:4326)
source      : n20w120_con.tif
name        : n25w115_con
flood_polygon_data3 <- glue("/vsizip/vsicurl/https://data.hydrosheds.org/file/hydrosheds-v1-con/na_con_3s/n40w080_con.zip/n40w080_con.tif") %>%
  rast() #%>%
  #st_as_sf(coords = c("lon","lat"))

flood_polygon_data3
class       : SpatRaster
dimensions  : 12000, 12000, 1  (nrow, ncol, nlyr)
resolution  : 0.0008333333, 0.0008333333  (x, y)
extent      : -80, -70, 40, 50  (xmin, xmax, ymin, ymax)
coord. ref. : lon/lat WGS 84 (EPSG:4326)
source      : n40w080_con.tif
name        : n45w075_con
ggplot() +
  geom_spatraster(data=flood_polygon_data) +
  geom_spatraster(data=flood_polygon_data2) +
  geom_spatraster(data=flood_polygon_data3) +
  theme_tufte()
SpatRaster resampled to ncells = 501264
SpatRaster resampled to ncells = 501264
SpatRaster resampled to ncells = 501264
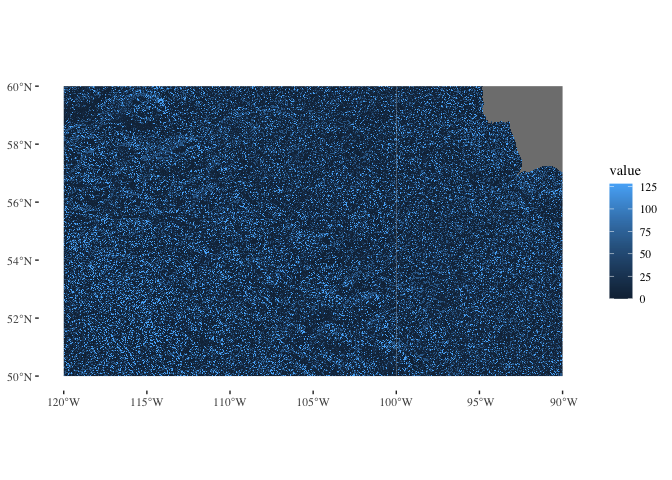
flood_polygon_data <- glue("/vsizip/vsicurl/https://data.hydrosheds.org/file/hydrosheds-v1-dir/na_dir_3s/n50w100_dir.zip/n50w100_dir.tif") %>%
  rast() #%>%
  #st_as_sf(coords = c("lon","lat"))

flood_polygon_data
class       : SpatRaster
dimensions  : 12000, 12000, 1  (nrow, ncol, nlyr)
resolution  : 0.0008333333, 0.0008333333  (x, y)
extent      : -100, -90, 50, 60  (xmin, xmax, ymin, ymax)
coord. ref. : lon/lat WGS 84 (EPSG:4326)
source      : n50w100_dir.tif
name        : n55w095_dir
flood_polygon_data2 <- glue("/vsizip/vsicurl/https://data.hydrosheds.org/file/hydrosheds-v1-dir/na_dir_3s/n50w110_dir.zip/n50w110_dir.tif") %>%
  rast() #%>%
  #st_as_sf(coords = c("lon","lat"))

flood_polygon_data2
class       : SpatRaster
dimensions  : 12000, 12000, 1  (nrow, ncol, nlyr)
resolution  : 0.0008333333, 0.0008333333  (x, y)
extent      : -110, -100, 50, 60  (xmin, xmax, ymin, ymax)
coord. ref. : lon/lat WGS 84 (EPSG:4326)
source      : n50w110_dir.tif
name        : n55w105_dir
flood_polygon_data3 <- glue("/vsizip/vsicurl/https://data.hydrosheds.org/file/hydrosheds-v1-dir/na_dir_3s/n50w120_dir.zip/n50w120_dir.tif") %>%
  rast() #%>%
  #st_as_sf(coords = c("lon","lat"))

flood_polygon_data3
class       : SpatRaster
dimensions  : 12000, 12000, 1  (nrow, ncol, nlyr)
resolution  : 0.0008333333, 0.0008333333  (x, y)
extent      : -120, -110, 50, 60  (xmin, xmax, ymin, ymax)
coord. ref. : lon/lat WGS 84 (EPSG:4326)
source      : n50w120_dir.tif
name        : n55w115_dir
ggplot() +
  geom_spatraster(data=flood_polygon_data) +
  geom_spatraster(data=flood_polygon_data2) +
  geom_spatraster(data=flood_polygon_data3) +
  theme_tufte()
SpatRaster resampled to ncells = 501264
SpatRaster resampled to ncells = 501264
SpatRaster resampled to ncells = 501264
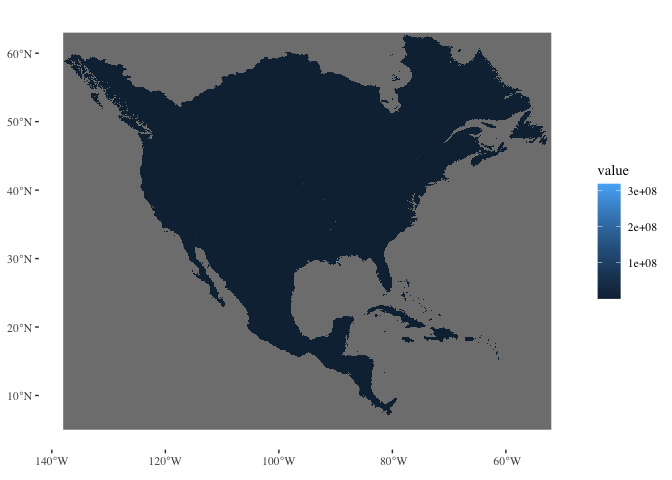
flood_polygon_data3 <- glue("/vsizip/vsicurl/https://data.hydrosheds.org/file/hydrosheds-v1-aca/hyd_na_aca_15s.zip/hyd_na_aca_15s.tif") %>%
  rast() #%>%
  #st_as_sf(coords = c("lon","lat"))

flood_polygon_data3
class       : SpatRaster
dimensions  : 13920, 20640, 1  (nrow, ncol, nlyr)
resolution  : 0.004166667, 0.004166667  (x, y)
extent      : -138, -52, 5, 63  (xmin, xmax, ymin, ymax)
coord. ref. : lon/lat WGS 84 (EPSG:4326)
source      : hyd_na_aca_15s.tif
name        : Band_1
ggplot() +

  geom_spatraster(data=flood_polygon_data3) +
  theme_tufte()
SpatRaster resampled to ncells = 500822
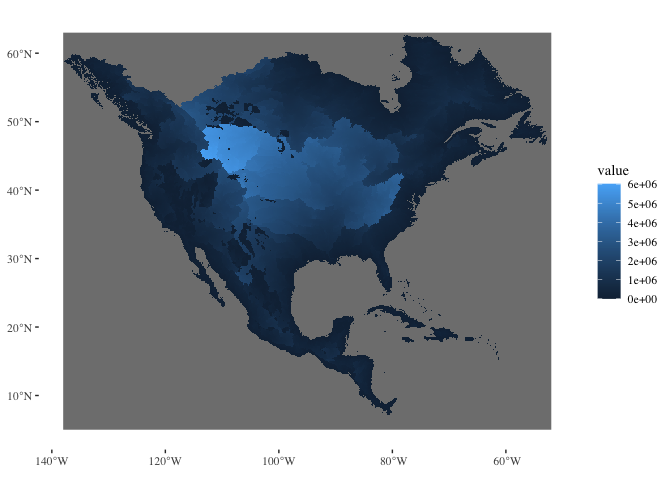
flood_polygon_data3 <- glue("/vsizip/vsicurl/https://data.hydrosheds.org/file/hydrosheds-v1-ldn/hyd_na_ldn_15s.zip/hyd_na_ldn_15s.tif") %>%
  rast() #%>%
  #st_as_sf(coords = c("lon","lat"))

flood_polygon_data3
class       : SpatRaster
dimensions  : 13920, 20640, 1  (nrow, ncol, nlyr)
resolution  : 0.004166667, 0.004166667  (x, y)
extent      : -138, -52, 5, 63  (xmin, xmax, ymin, ymax)
coord. ref. : lon/lat WGS 84 (EPSG:4326)
source      : hyd_na_ldn_15s.tif
name        : af_len_dn_15s
ggplot() +

  geom_spatraster(data=flood_polygon_data3) +
  theme_tufte()
SpatRaster resampled to ncells = 500822
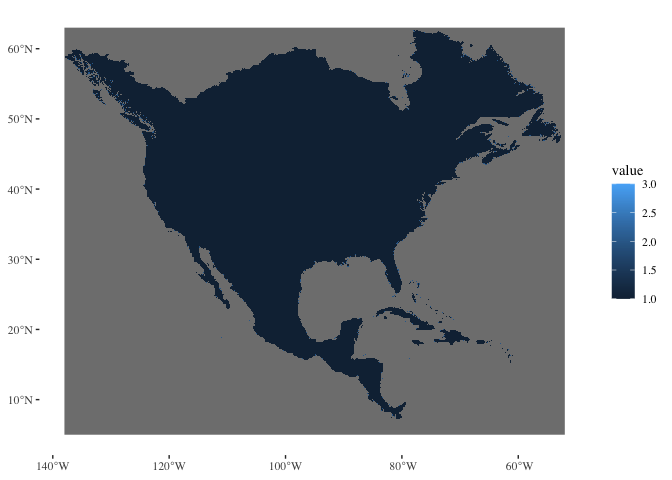
flood_polygon_data3 <- glue("/vsizip/vsicurl/https://data.hydrosheds.org/file/hydrosheds-v1-msk/hyd_na_msk_15s.zip/hyd_na_msk_15s.tif") %>%
  rast() #%>%
  #st_as_sf(coords = c("lon","lat"))

flood_polygon_data3
class       : SpatRaster
dimensions  : 13920, 20640, 1  (nrow, ncol, nlyr)
resolution  : 0.004166667, 0.004166667  (x, y)
extent      : -138, -52, 5, 63  (xmin, xmax, ymin, ymax)
coord. ref. : lon/lat WGS 84 (EPSG:4326)
source      : hyd_na_msk_15s.tif
name        : Band_1
ggplot() +

  geom_spatraster(data=flood_polygon_data3) +
  theme_tufte()
SpatRaster resampled to ncells = 500822
flood_polygon_data3 <- glue("/vsizip/vsicurl/https://data.hydrosheds.org/file/hydrosheds-associated/gloric/GloRiC_v10_shapefile.zip/GloRiC_v10_shapefile/GloRiC_v10.shp") %>%
  st_read() %>%
  st_as_sf(coords = c("lon","lat"))

flood_polygon_data3
ggplot() +

  geom_spatraster(data=flood_polygon_data3) +
  theme_tufte()
https://figshare.com/ndownloader/files/31910714
https://data.hydrosheds.org/file/hydrosheds-associated/gloric/GloRiC_Canada_v10_shapefile.zip
flood_polygon_data3 <- glue("/vsizip/vsicurl/https://data.hydrosheds.org/file/hydrosheds-associated/gloric/GloRiC_Canada_v10_shapefile.zip/GloRiC_Canada_v10_shapefile.csv") %>%
  vect()
flood_polygon_data3
ggplot() +

  geom_spatraster(data=flood_polygon_data3) +
  theme_tufte()
Last update:
2023-11-16