What Fire VASE does
Fire VASE turns dated observations of wildfire growth into a common developmental response—then asks what might explain the differences.
→
→
→
→
→
→
Short answer
The analysis reconstructs each fire’s observed sequence, expresses cumulative growth on comparable relative-time coordinates, and compares those histories without using weather or endpoints to define the primary shape space. Weather and recent fire state enter only afterward as candidate explanatory layers.
Seven stages, with technical routes
01 · Observe
Start with dated fire polygons
FIRED event and daily records identify where and when satellite observations attribute newly burned area to a reconstructed fire. The full reanalysis begins with 278,569 events and 626,102 cached observations.
02 · Order
Reconstruct the observed history
Daily increments are ordered by date and audited for gaps, duplicates, nonfinite values, and agreement with source geometry. An observation gap stays a gap; it is never silently converted into a no-growth day.
03 · Standardize
Put histories on comparable coordinates
For the primary cohort, each increment occupies an equal-width relative-time interval. Interpolating cumulative mass at 21 fixed edges produces 20 nonnegative growth-allocation bins that sum to one. This aligns histories; it does not create new observations.
04 · Represent
Construct the Fire VASE
Time runs upward. Each observed slice adds a ring; its radius is proportional to the square root of normalized cumulative burned area. A VASE is a retrospective developmental record—not a geographic perimeter, spread direction, mechanistic model, or natural fire type.
05 · Compare
Build a developmental morphospace
Mean-centered, standardized PCA compares the 20 allocation bins for 10,246 fires with at least three consecutive daily observations. Final area, duration, observation count, absolute peak growth, and weather are excluded from the primary coordinate construction.
06 · Explain
Add external layers afterward
Event-level weather models use 9,212 complete primary fires. A separate state analysis uses 87,944 exact next-day transitions from 31,700 fires to ask what weather adds beyond known recent growth, cumulative area, and elapsed time.
07 · Challenge
Test the claim’s weak points
Observation thresholds, temporal shuffles, alternative allocation nulls, compositional geometry, blocked transfer, spatial attribution, matching choices, deliberate corruptions, and software tests probe where the result is stable and where it is conditional.
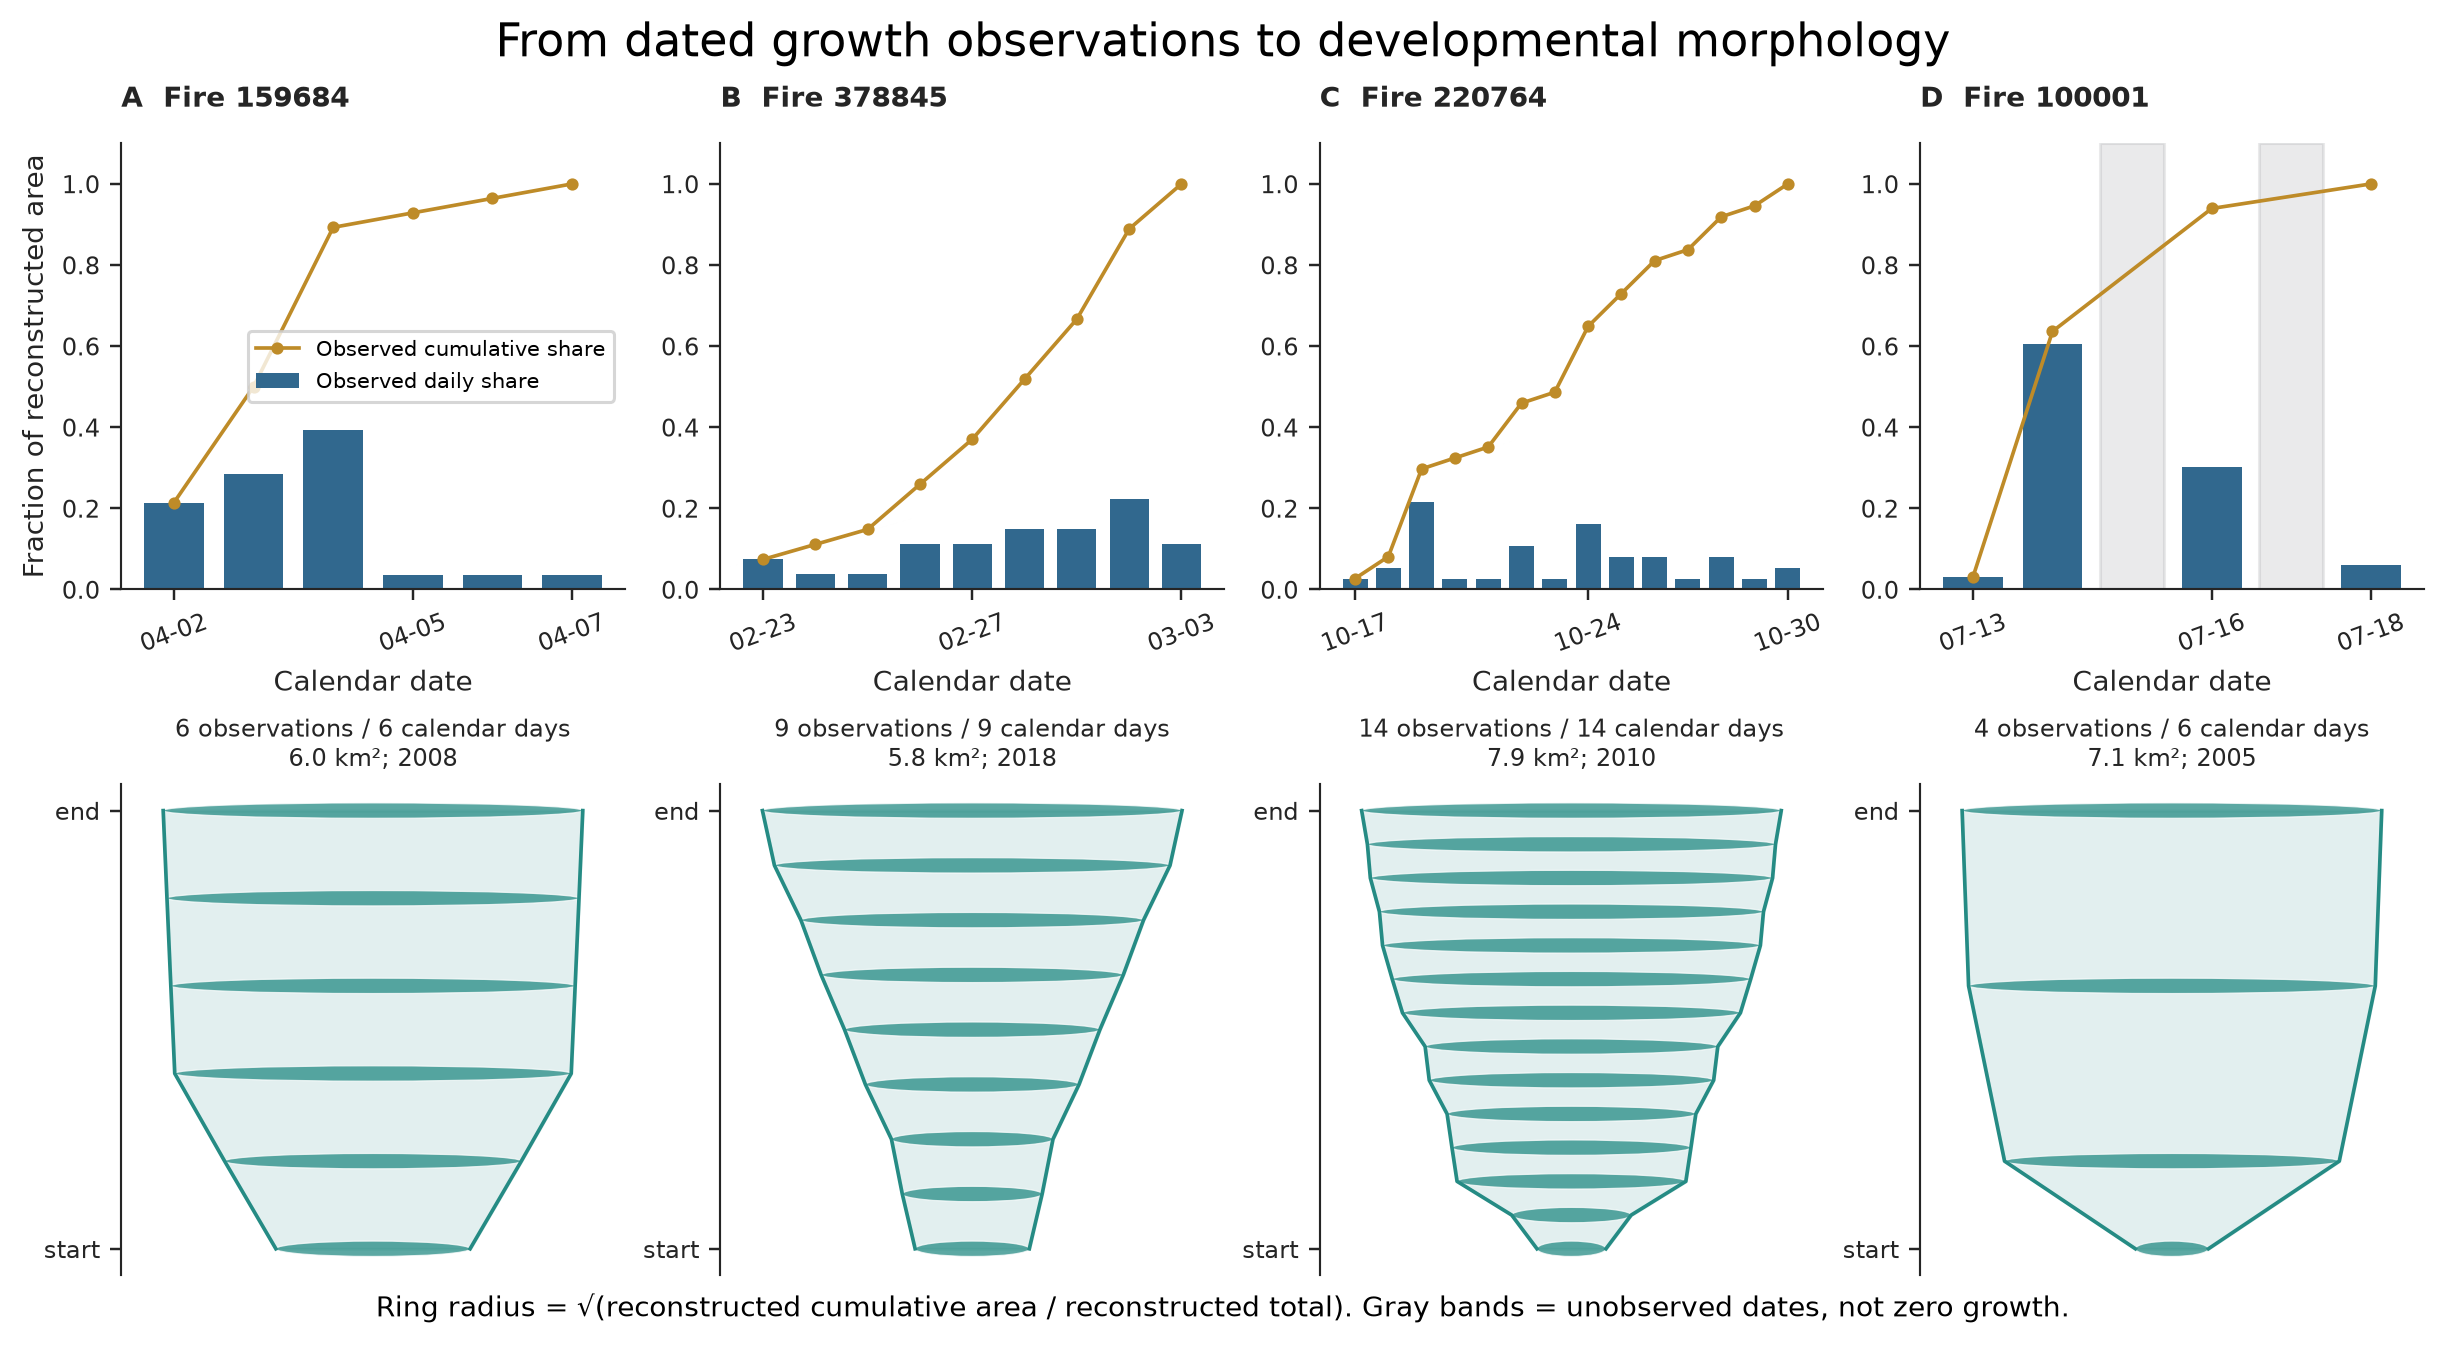
Read from top to bottom. Bars show each observed daily share; the line shows cumulative reconstructed area; the lower glyph preserves that ordered accumulation. Fire 100001 includes unobserved dates, shown as gray bands, and is therefore not part of the consecutive-history primary morphospace. Full caption and figure provenance
How to read this figure
What was measured—and what was not
| Layer | Quantity | Interpretation boundary |
|---|---|---|
| Observations | Dated FIRED area increments | Retrospective satellite-derived record, not continuous flame-front telemetry |
| Development | Normalized allocation through relative time | Comparable history, not absolute size or spread direction |
| Morphospace | PCA of 20 allocation bins | Continuous coordinates; labels are landmarks, not established classes |
| Weather | Daily gridMET conditions, roughly 4-km resolution | External association; not local fuel load, causal effect, or operational forecast |
| Recent state | Current/prior growth, cumulative area, elapsed time | Strong retrospective predictor; availability in real time is not established |
| Matching | Unique, caliper-constrained pairs | Hypothesis-generating cases; mismatch is design-dependent, not prevalence |
Technical details
The technical manuscript defines the equations, folds, resampling, matching rules, and claim boundaries. The second-generation analysis record traces corrections and frozen outputs.