The five current manuscript figures form one argument: encode the observed history, compare developmental form, add weather as an external layer, condition on recent state, and use mismatches to choose the next measurements.
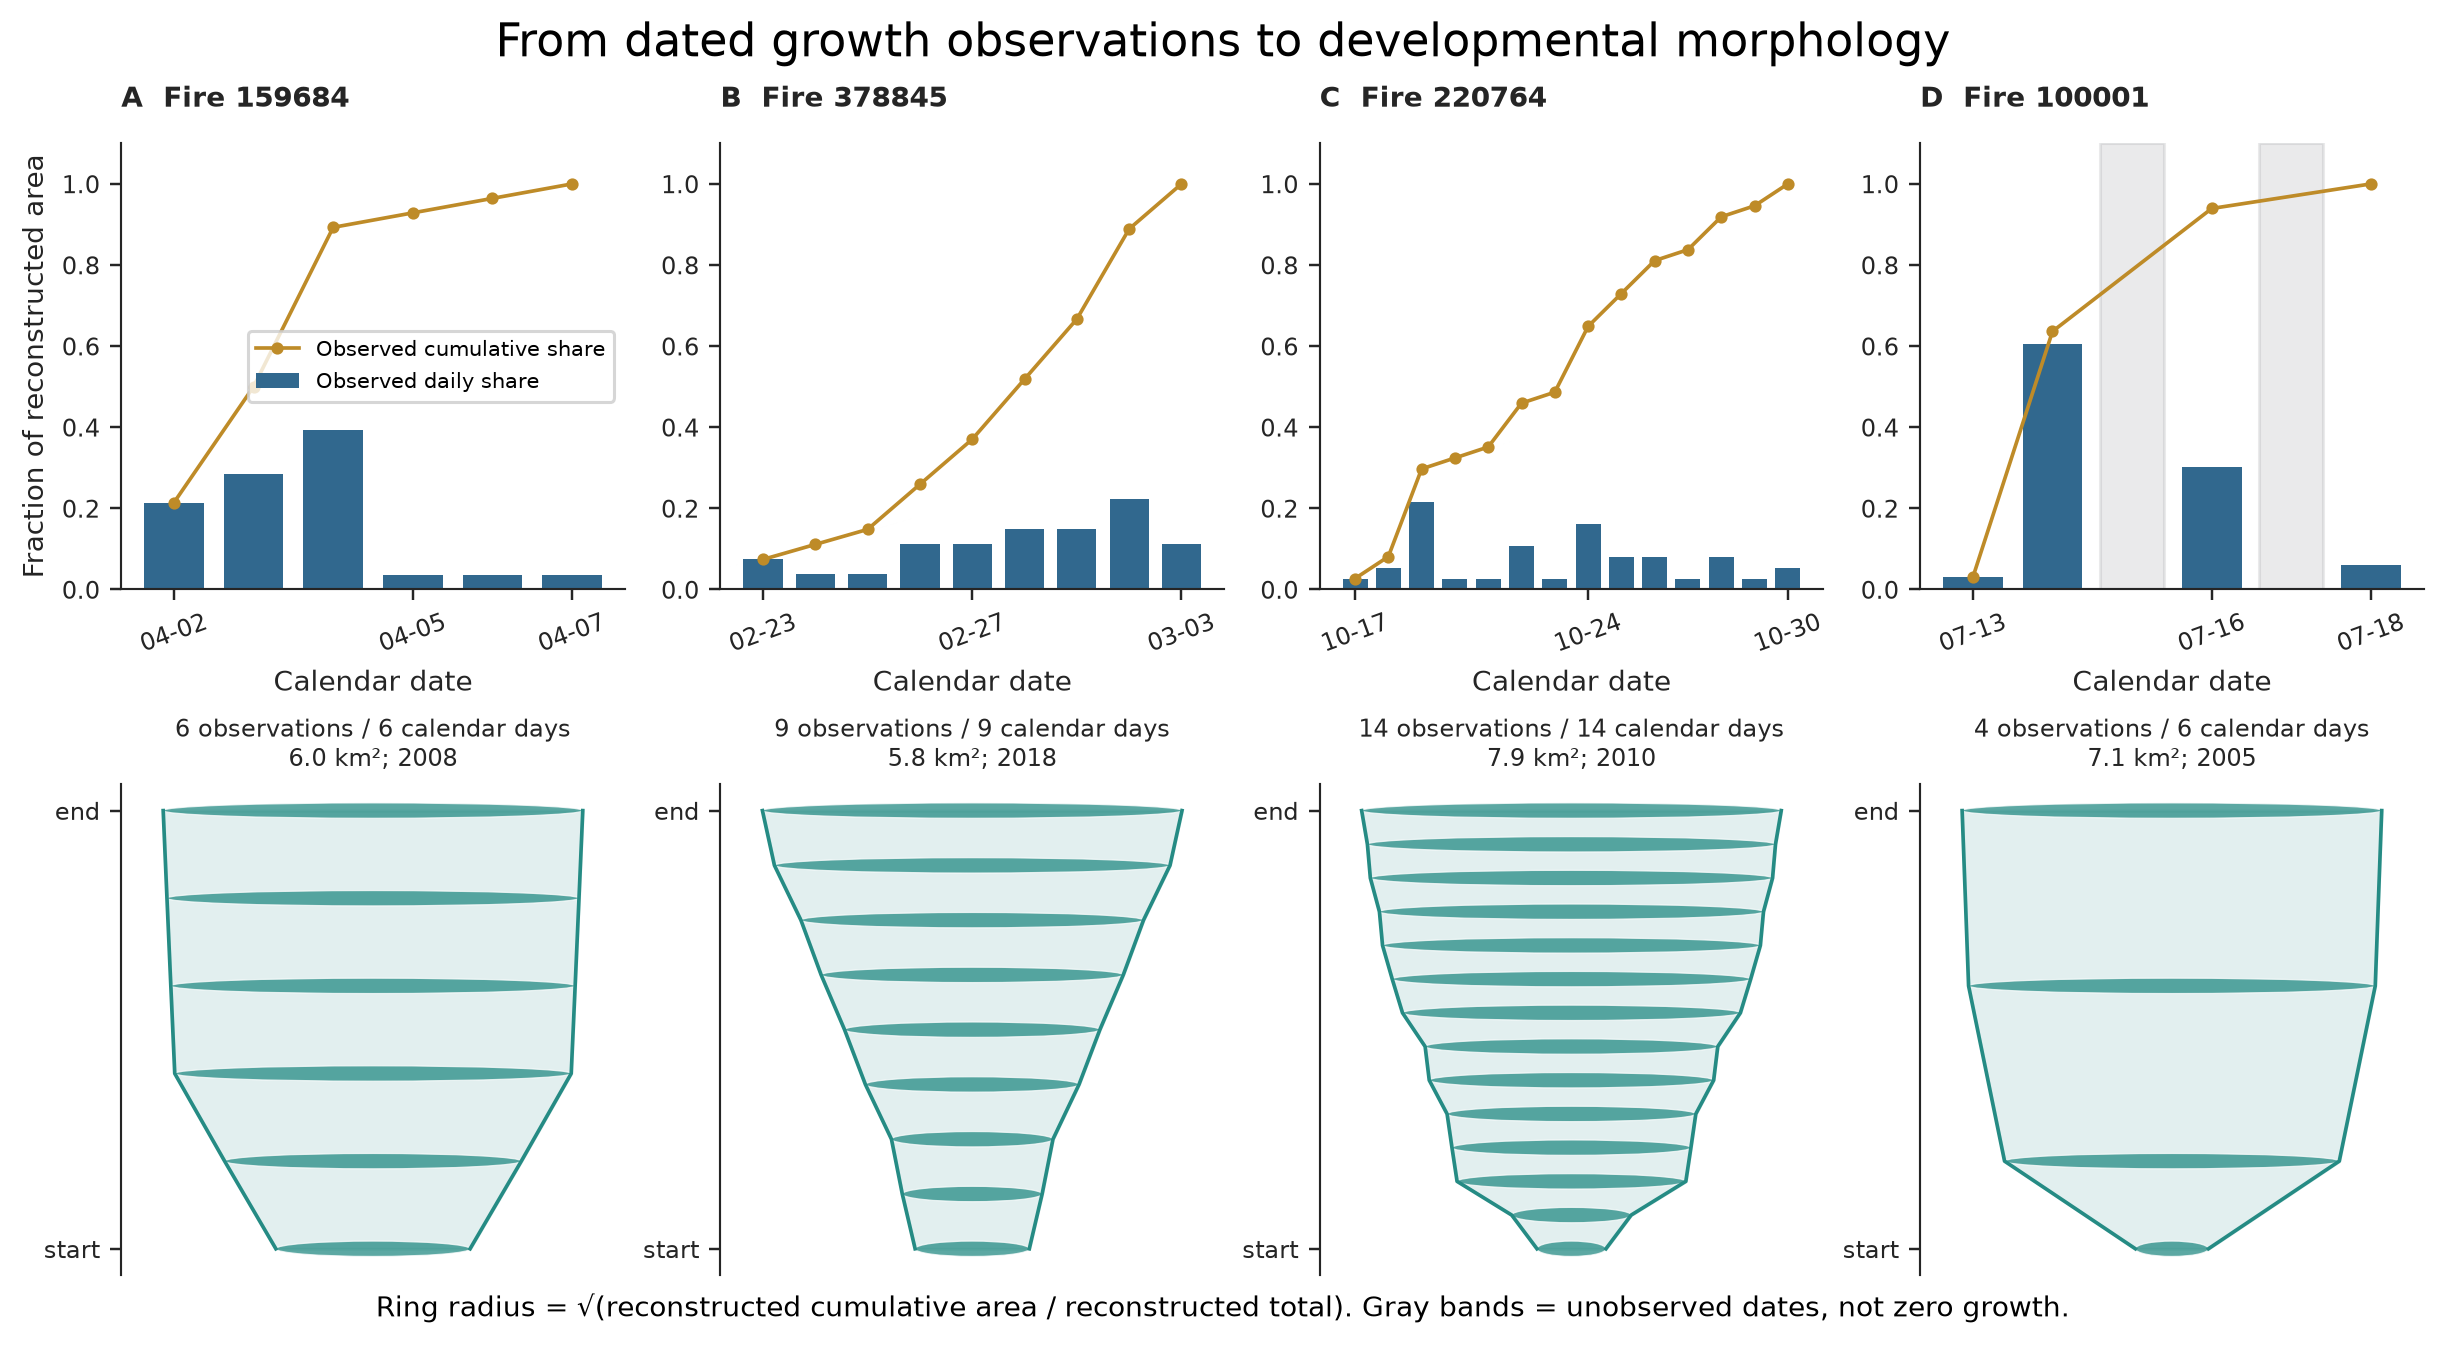
One endpoint can conceal many ordered histories. Fire VASE makes the allocation of observed growth through time visible and comparable.
How to read this figure
- **Panels:** Each column is one real fire. Bars show daily growth share; the
line shows cumulative share; the VASE below is the same history rendered as
widening rings.
- **Axes and objects:** Calendar time runs left to right in the charts and
relative developmental time runs upward in each VASE. Width is the square
root of cumulative reconstructed-area share.
- **Look here:** Compare the early jump in Fire 159684 with the steadier
accumulation in Fire 378845 and the longer, episodic record in Fire 220764.
- **Comparison:** Similar endpoints do not imply similar ordered development.
- **Supported conclusion:** The representation preserves ordering and exposes
observation gaps; it does not identify a causal mechanism.
Four verified FIRED events connect observed daily area increments,
cumulative area, and VASE rings. Gray bands are unobserved dates, not
zero-growth days; the VASE records normalized allocation through time
rather than geographic shape.
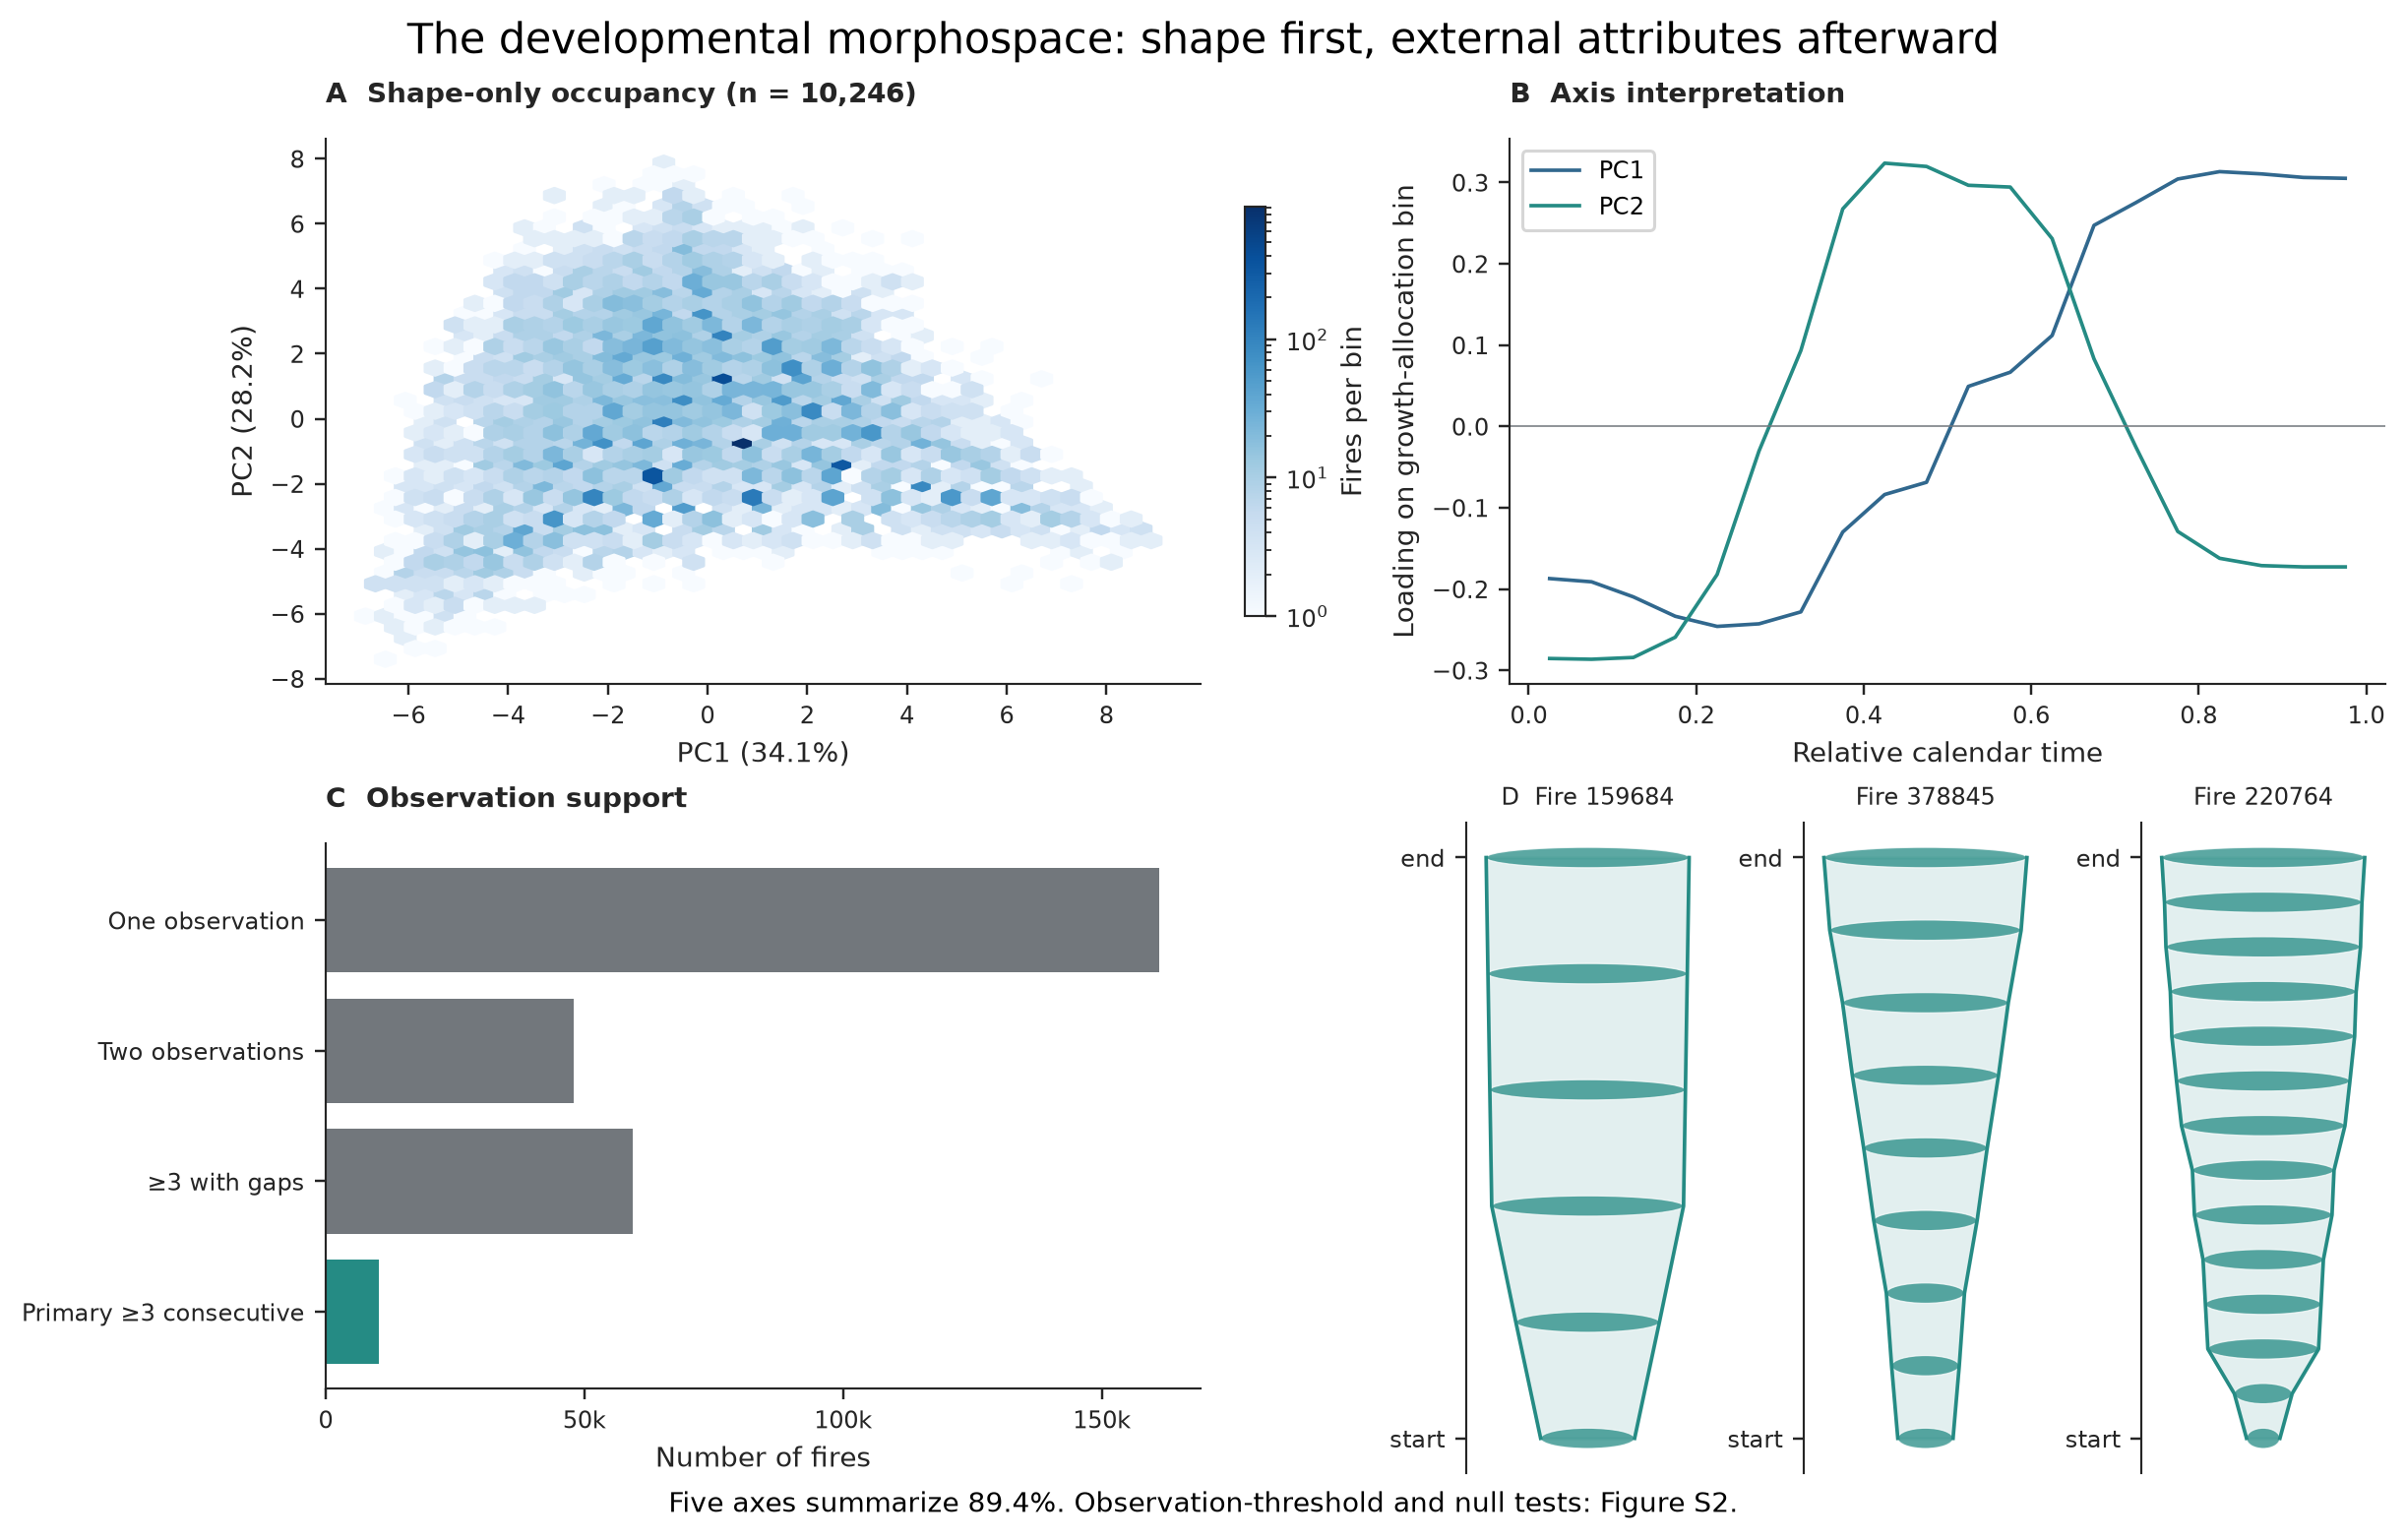
Figure 2: Fire histories occupy broad developmental gradients
Adequately observed fires fill a continuous shape space. The leading directions describe when growth is allocated—not discrete fire types.
How to read this figure
- **Panels:** A maps where fires fall; B shows which relative-time bins define
PC1 and PC2; C shows how many archive fires meet each observation category;
D gives real example VASEs.
- **Axes:** PC1 explains 34.1% and primarily contrasts earlier with later
allocation. PC2 explains 28.2% and contrasts middle-concentrated with more
endpoint-weighted allocation.
- **Look here:** The points spread continuously across the horizontal gradient
instead of separating into isolated clusters.
- **Comparison:** Read the loadings and VASE examples together; neither the
point cloud nor a label alone supplies the interpretation.
- **Supported conclusion:** Broad developmental gradients are reproducible.
Natural fire classes and a universal restricted wedge were not established.
Challenge this result If
the gradients vanished when more observations or another compositional metric
were required, short-history or geometry choices could explain the pattern.
See those tests →
A shape-only coordinate system is fitted from 20 normalized
growth-allocation bins for 10,246 gap-free histories. The broad gradients
are reproducible, while exact neighbors, extreme examples, and
low-dimensional compression require supplementary qualifications.
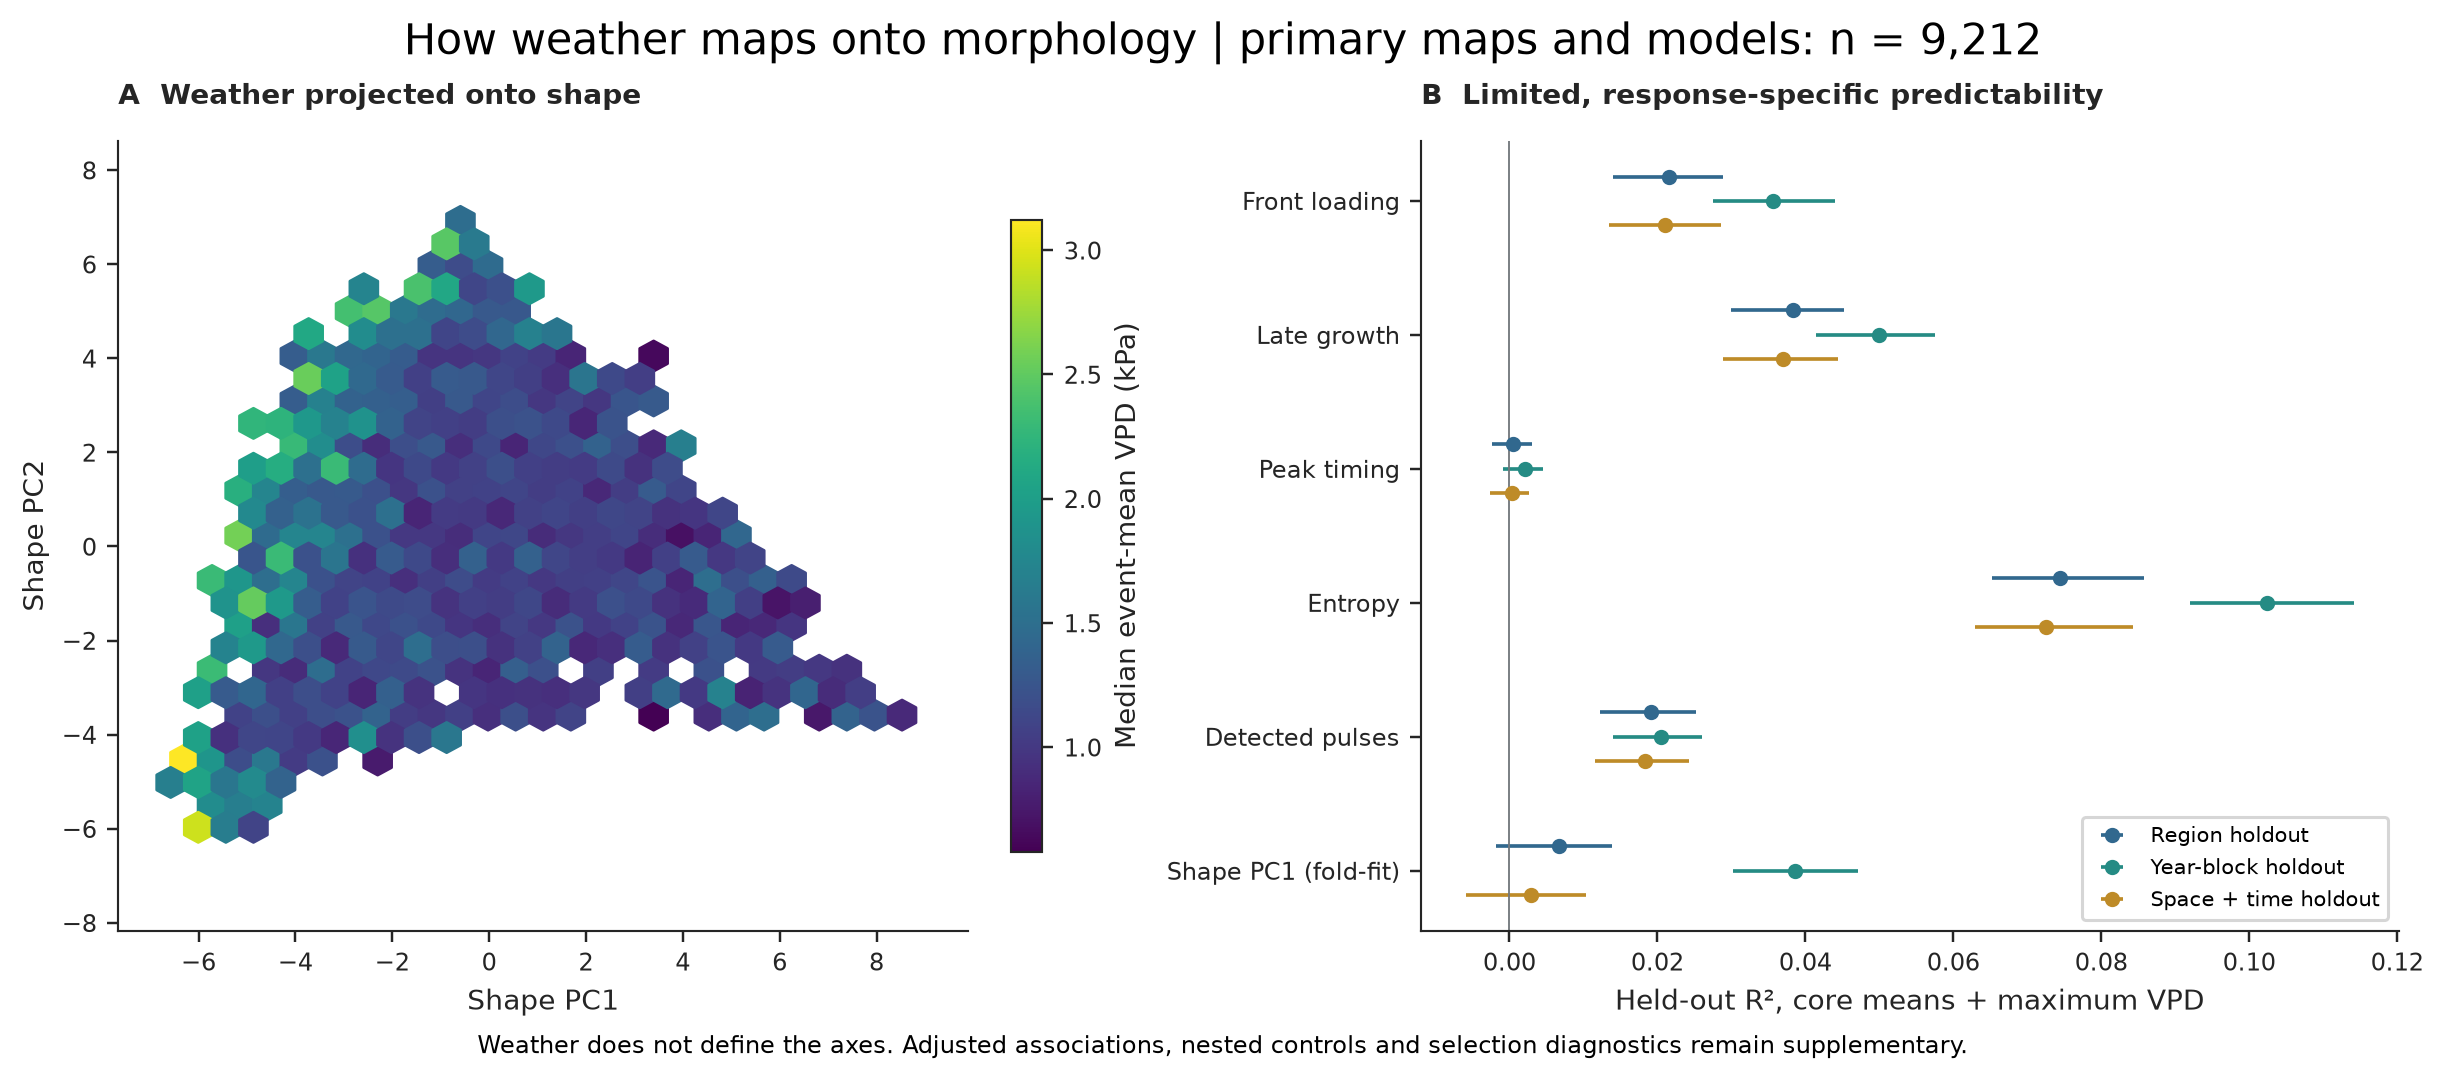
Figure 3: Measured weather maps weakly and unevenly onto form
Weather is added after the developmental axes are built. Its held-out relationship with morphology is small and depends on the response being predicted.
How to read this figure
- **Panels:** A colors occupied regions of the already-fitted shape space by
median event-mean VPD. B shows held-out R² for several developmental
responses under region, year-block, and strict space-time tests.
- **Axes and colors:** Position is developmental shape; color is added weather,
not an input to those axes. In B, farther right means more predictive skill.
- **Look here:** Panel A does not show a clean weather gradient across shape,
and Panel B varies strongly by response; peak timing and fold-fitted shape PC1
are barely recovered regionally.
- **Comparison:** Compare outcomes and holdout schemes instead of searching for
one cross-response headline.
- **Supported conclusion:** Weather associations are weak and heterogeneous in
this cohort and model. The figure does not show that weather is unimportant.
Weather is projected after the axes are fitted. Held-out skill is small and
response-dependent across the same 9,212 weather-complete primary fires.
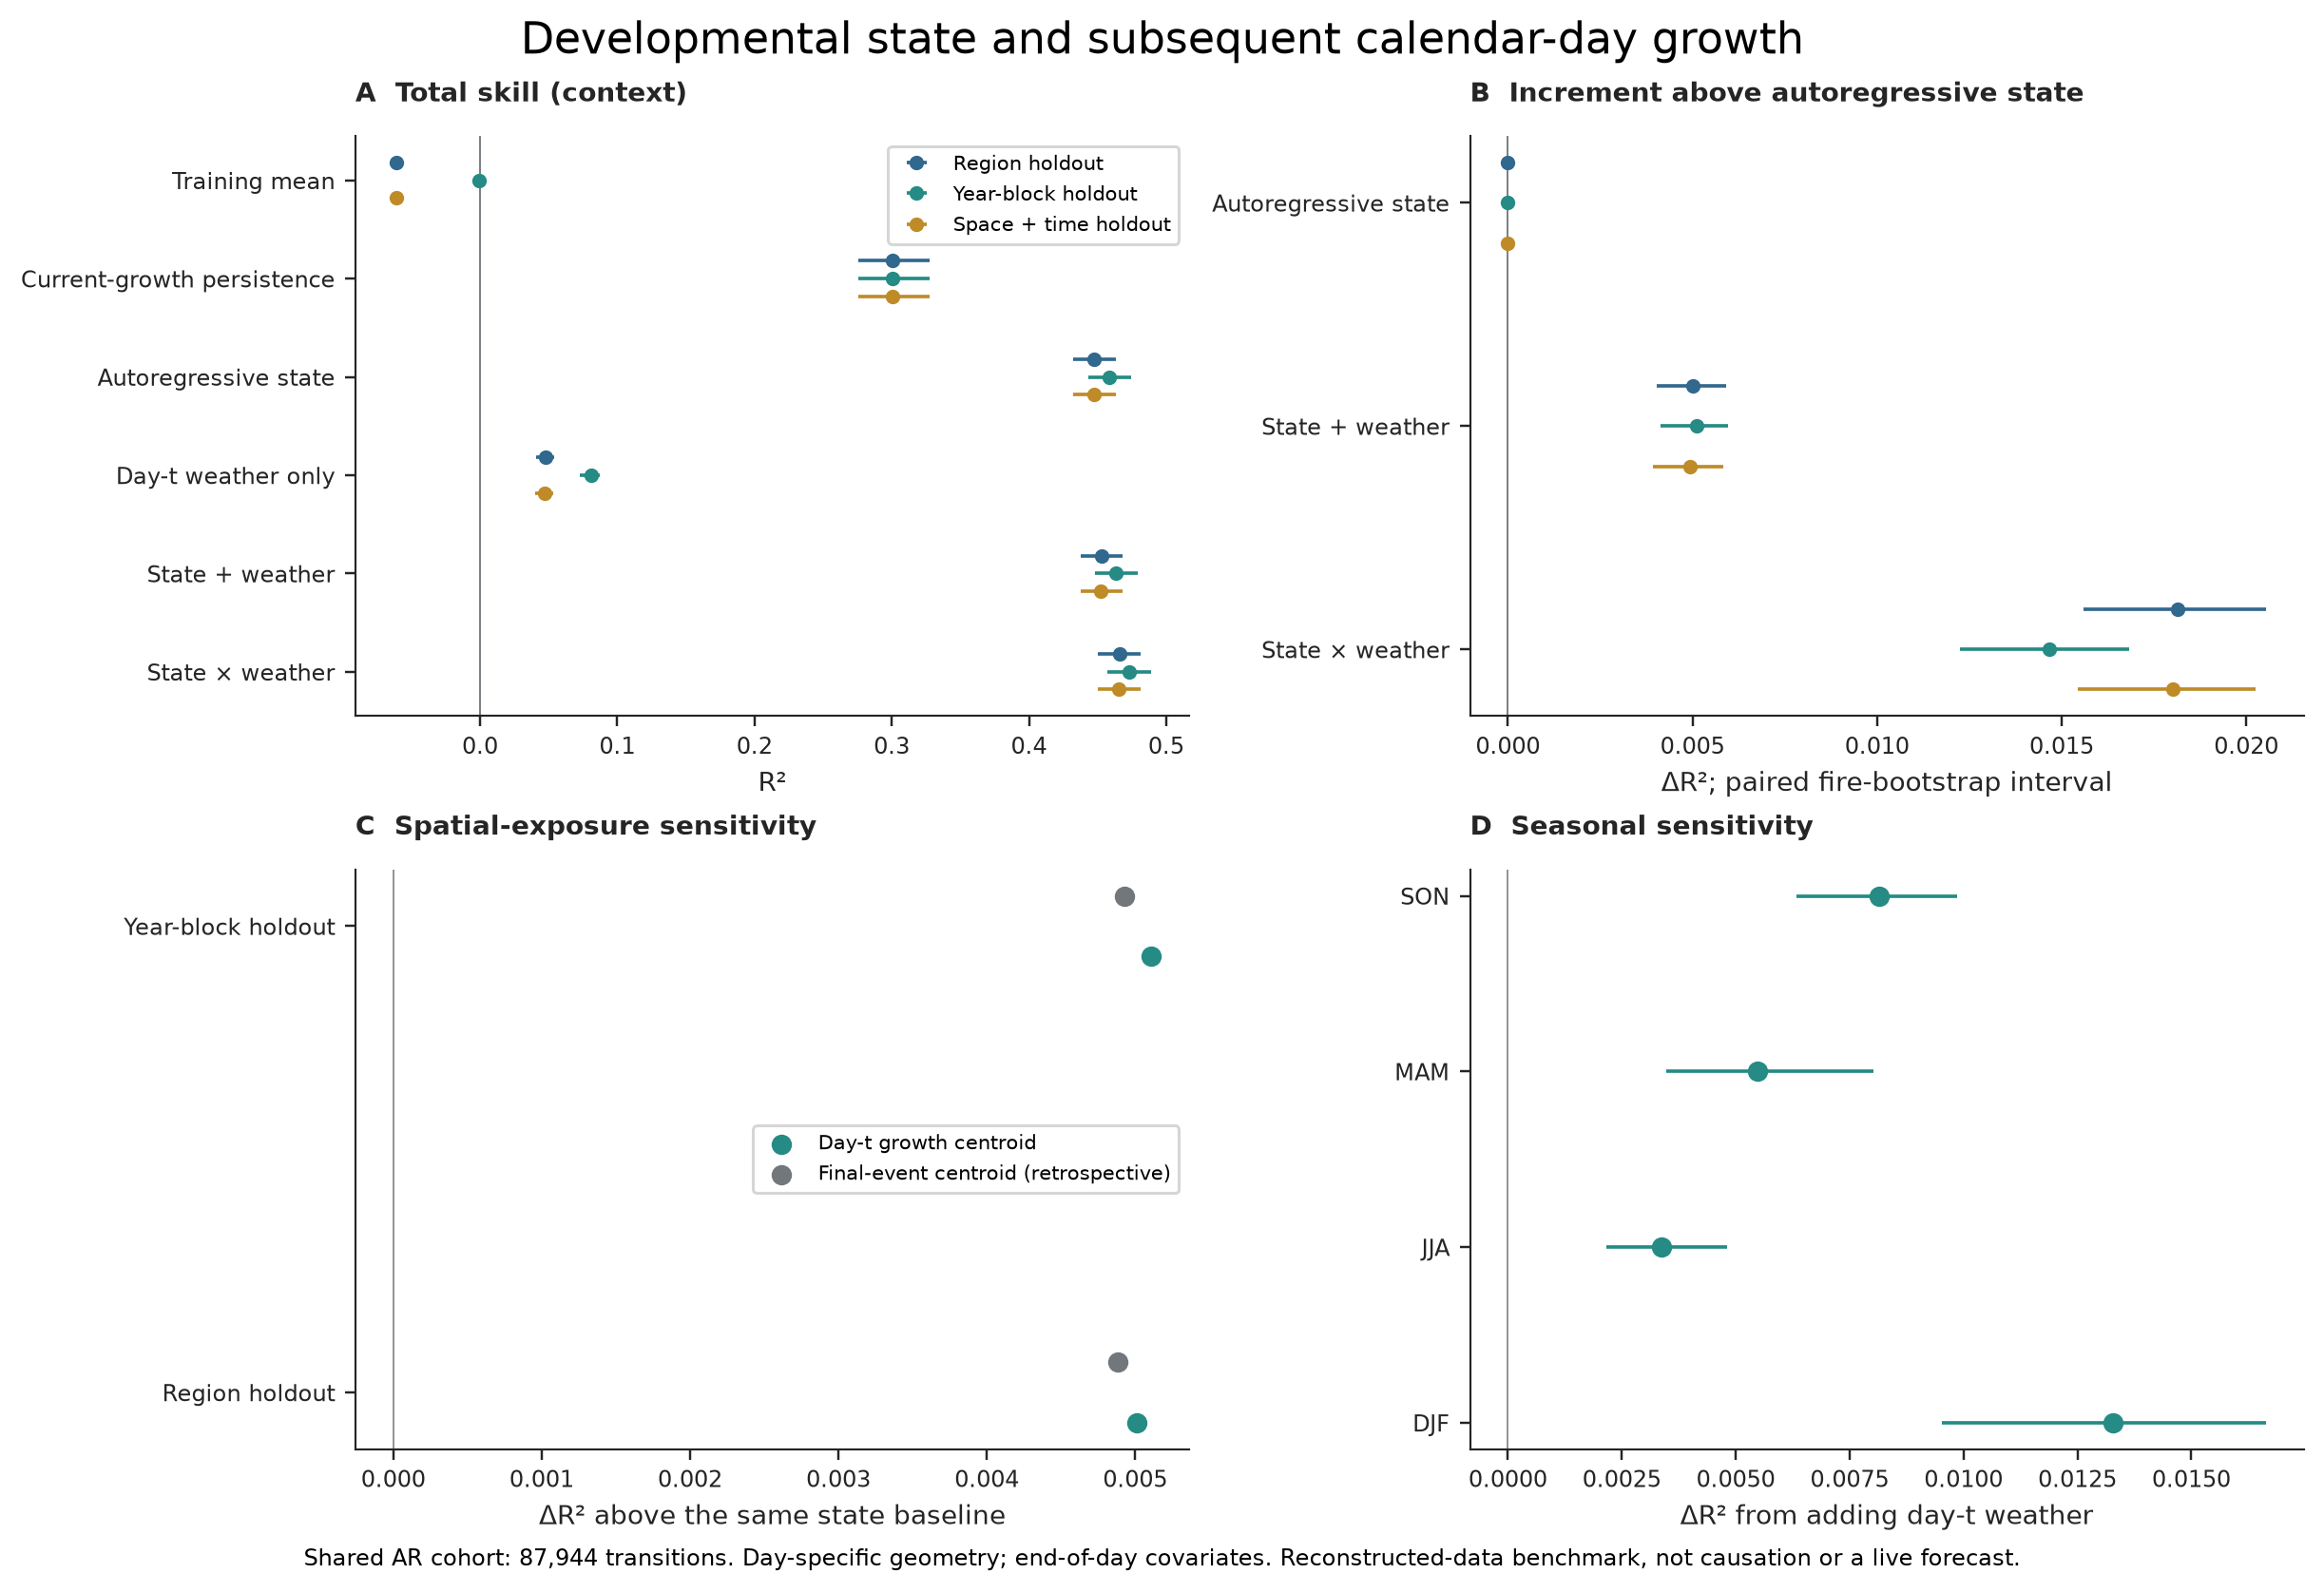
Figure 4: Recent state carries most next-day predictive information
Measured weather adds a reproducible but small increment after current and previous growth, cumulative area, and elapsed time are known.
How to read this figure
- **Panels:** A compares total held-out skill; B isolates increments above the
same state baseline; C changes exposure geometry; D checks seasons.
- **Axes:** In A, R² is total predictive performance. In B-D, ΔR² is only the
extra skill gained after recent state is already included.
- **Look here:** State sits near R² 0.45, while weather-only points sit much
closer to zero. Adding weather moves the state model only slightly.
- **Comparison:** The defensible weather comparison is incremental skill above
state—not total R² from the interaction model.
- **Supported conclusion:** Recent state predicts the next observed increment
much better than these weather variables add on top. This is not a causal or
operational forecast.
Trace this figure
ClaimRegion-held-out state R² 0.448; weather ΔR² 0.005; interactions ΔR² 0.018
Analysis87,944 exact transitions from 31,700 fires; paired blocked comparisons
In 87,944 exact next-day transitions, recent fire state provides most
predictive information; weather adds a small increment and weather-state
interactions add somewhat more. These are retrospective associations, not
an operational forecast or causal estimate.
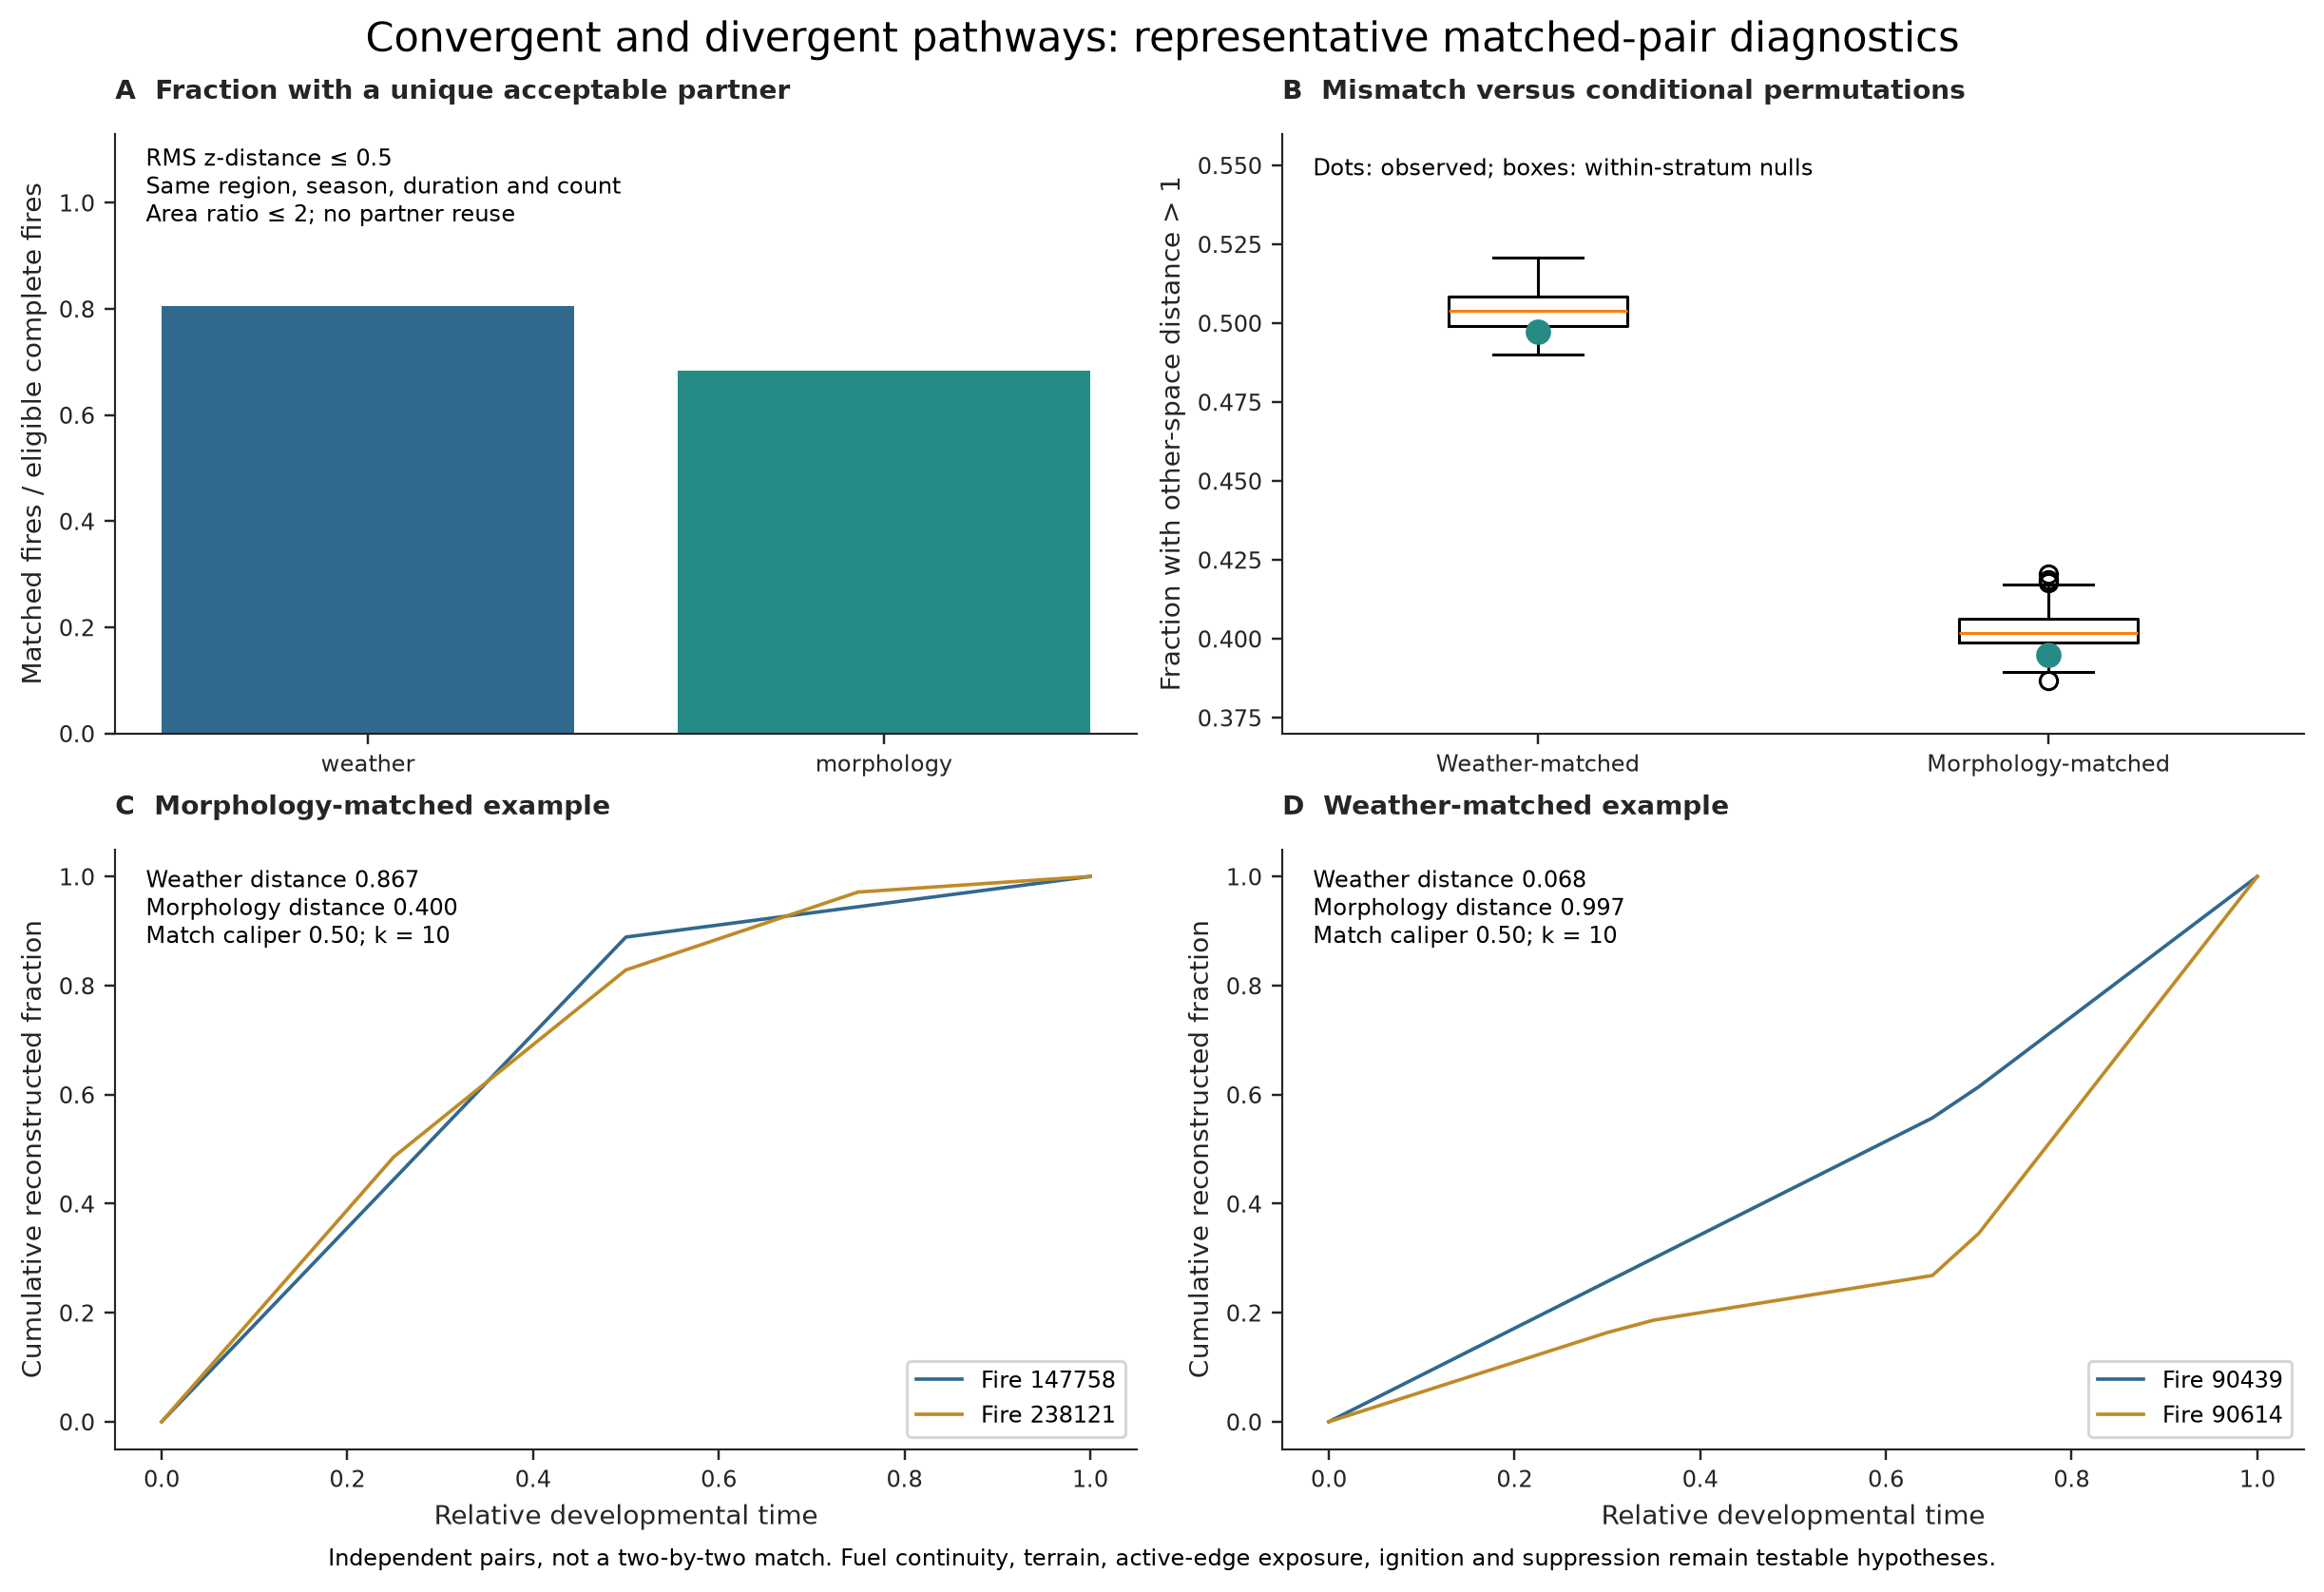
Figure 5: Matched mismatches define the next questions
Similar weather can accompany different developmental histories, and similar histories can accompany different weather—but observed mismatch is compatible with the conditional null.
How to read this figure
- **Panels:** A reports pair coverage; B compares observed mismatch dots with
conditional-null boxes; C and D show two independent representative pairs.
- **Axes:** The lower panels show cumulative reconstructed-area fraction across
relative developmental time. Distance values are standardized diagnostics.
- **Look here:** In B, the observed dots sit within the conditional reference
distributions. In D, closely weather-matched fires follow visibly different
histories.
- **Comparison:** Treat C and D as separate pairs, not rows and columns of one
reciprocal match.
- **Supported conclusion:** These are controlled cases for new measurements.
They do not establish excess mismatch, prevalence, or an omitted mechanism.
Unique, caliper-constrained pairs identify candidate contrasts, but
observed mismatch is compatible with the conditional reference
distribution. The examples generate hypotheses; they do not identify
omitted mechanisms.