Figure Gallery and Reproduction
This page keeps the complete visual record in one scrollable place. Start with the current submission figures, which match the corrected manuscript and supplement. The historical climate-revision figures remain below for comparison and provenance, but they are superseded and should not be used for current quantitative claims.
Read the current narrative Inspect the corrected evidence Download the assembled manuscript Download the assembled supplement
On this page
- Current main figures: Figures 1-5
- Current supplementary figures: Figures S1-S4
- Additional adversarial validation
- Historical main figures: Figures 1-5
- Historical supplementary figures: Figures S1-S3
- Reproduction instructions
How to read the archive
Current means the corrected v2/submission generation and controls the scientific interpretation. Historical means the earlier climate-revision generation, retained so collaborators can trace how the argument and tests changed. Select any image to open the full-size PNG.
Current main figures
These five figures follow the current representation-to-explanation sequence: encode the observed history, map developmental gradients, project weather, condition weather on recent fire state, and use matched cases to generate testable questions.
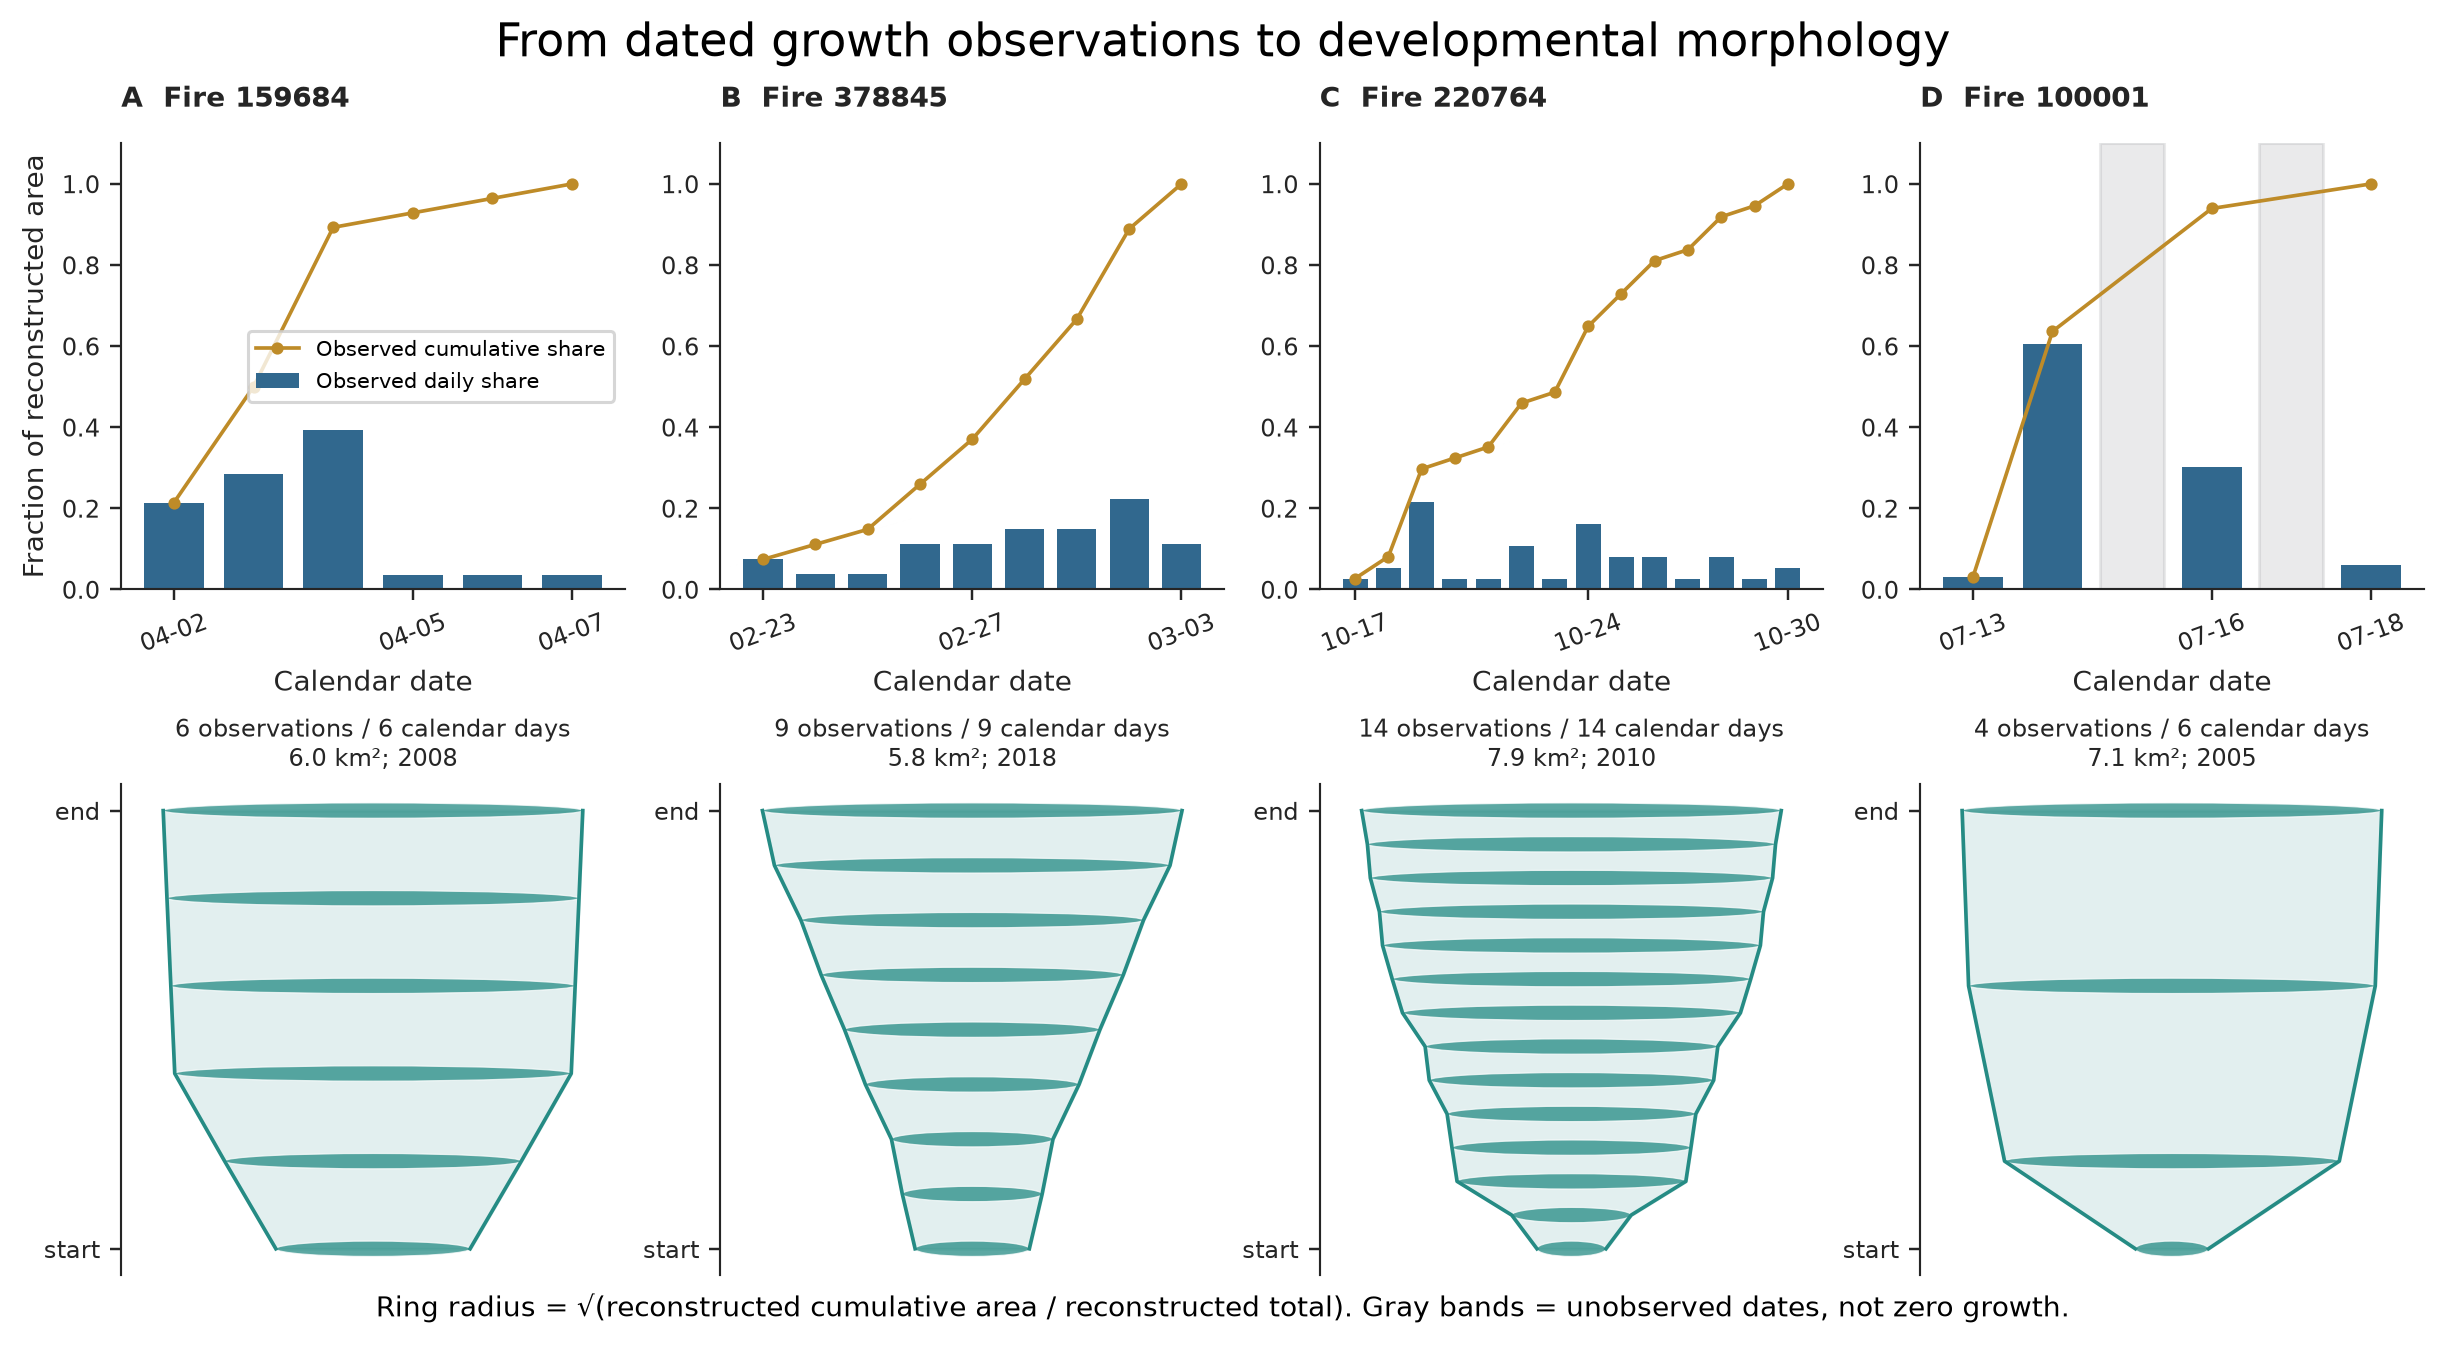
Figure 1. From dated growth observations to developmental morphology. Four verified FIRED events connect observed daily area increments, cumulative area, and VASE rings. Gray bands are unobserved dates, not zero-growth days; the VASE records normalized allocation through time rather than geographic shape.
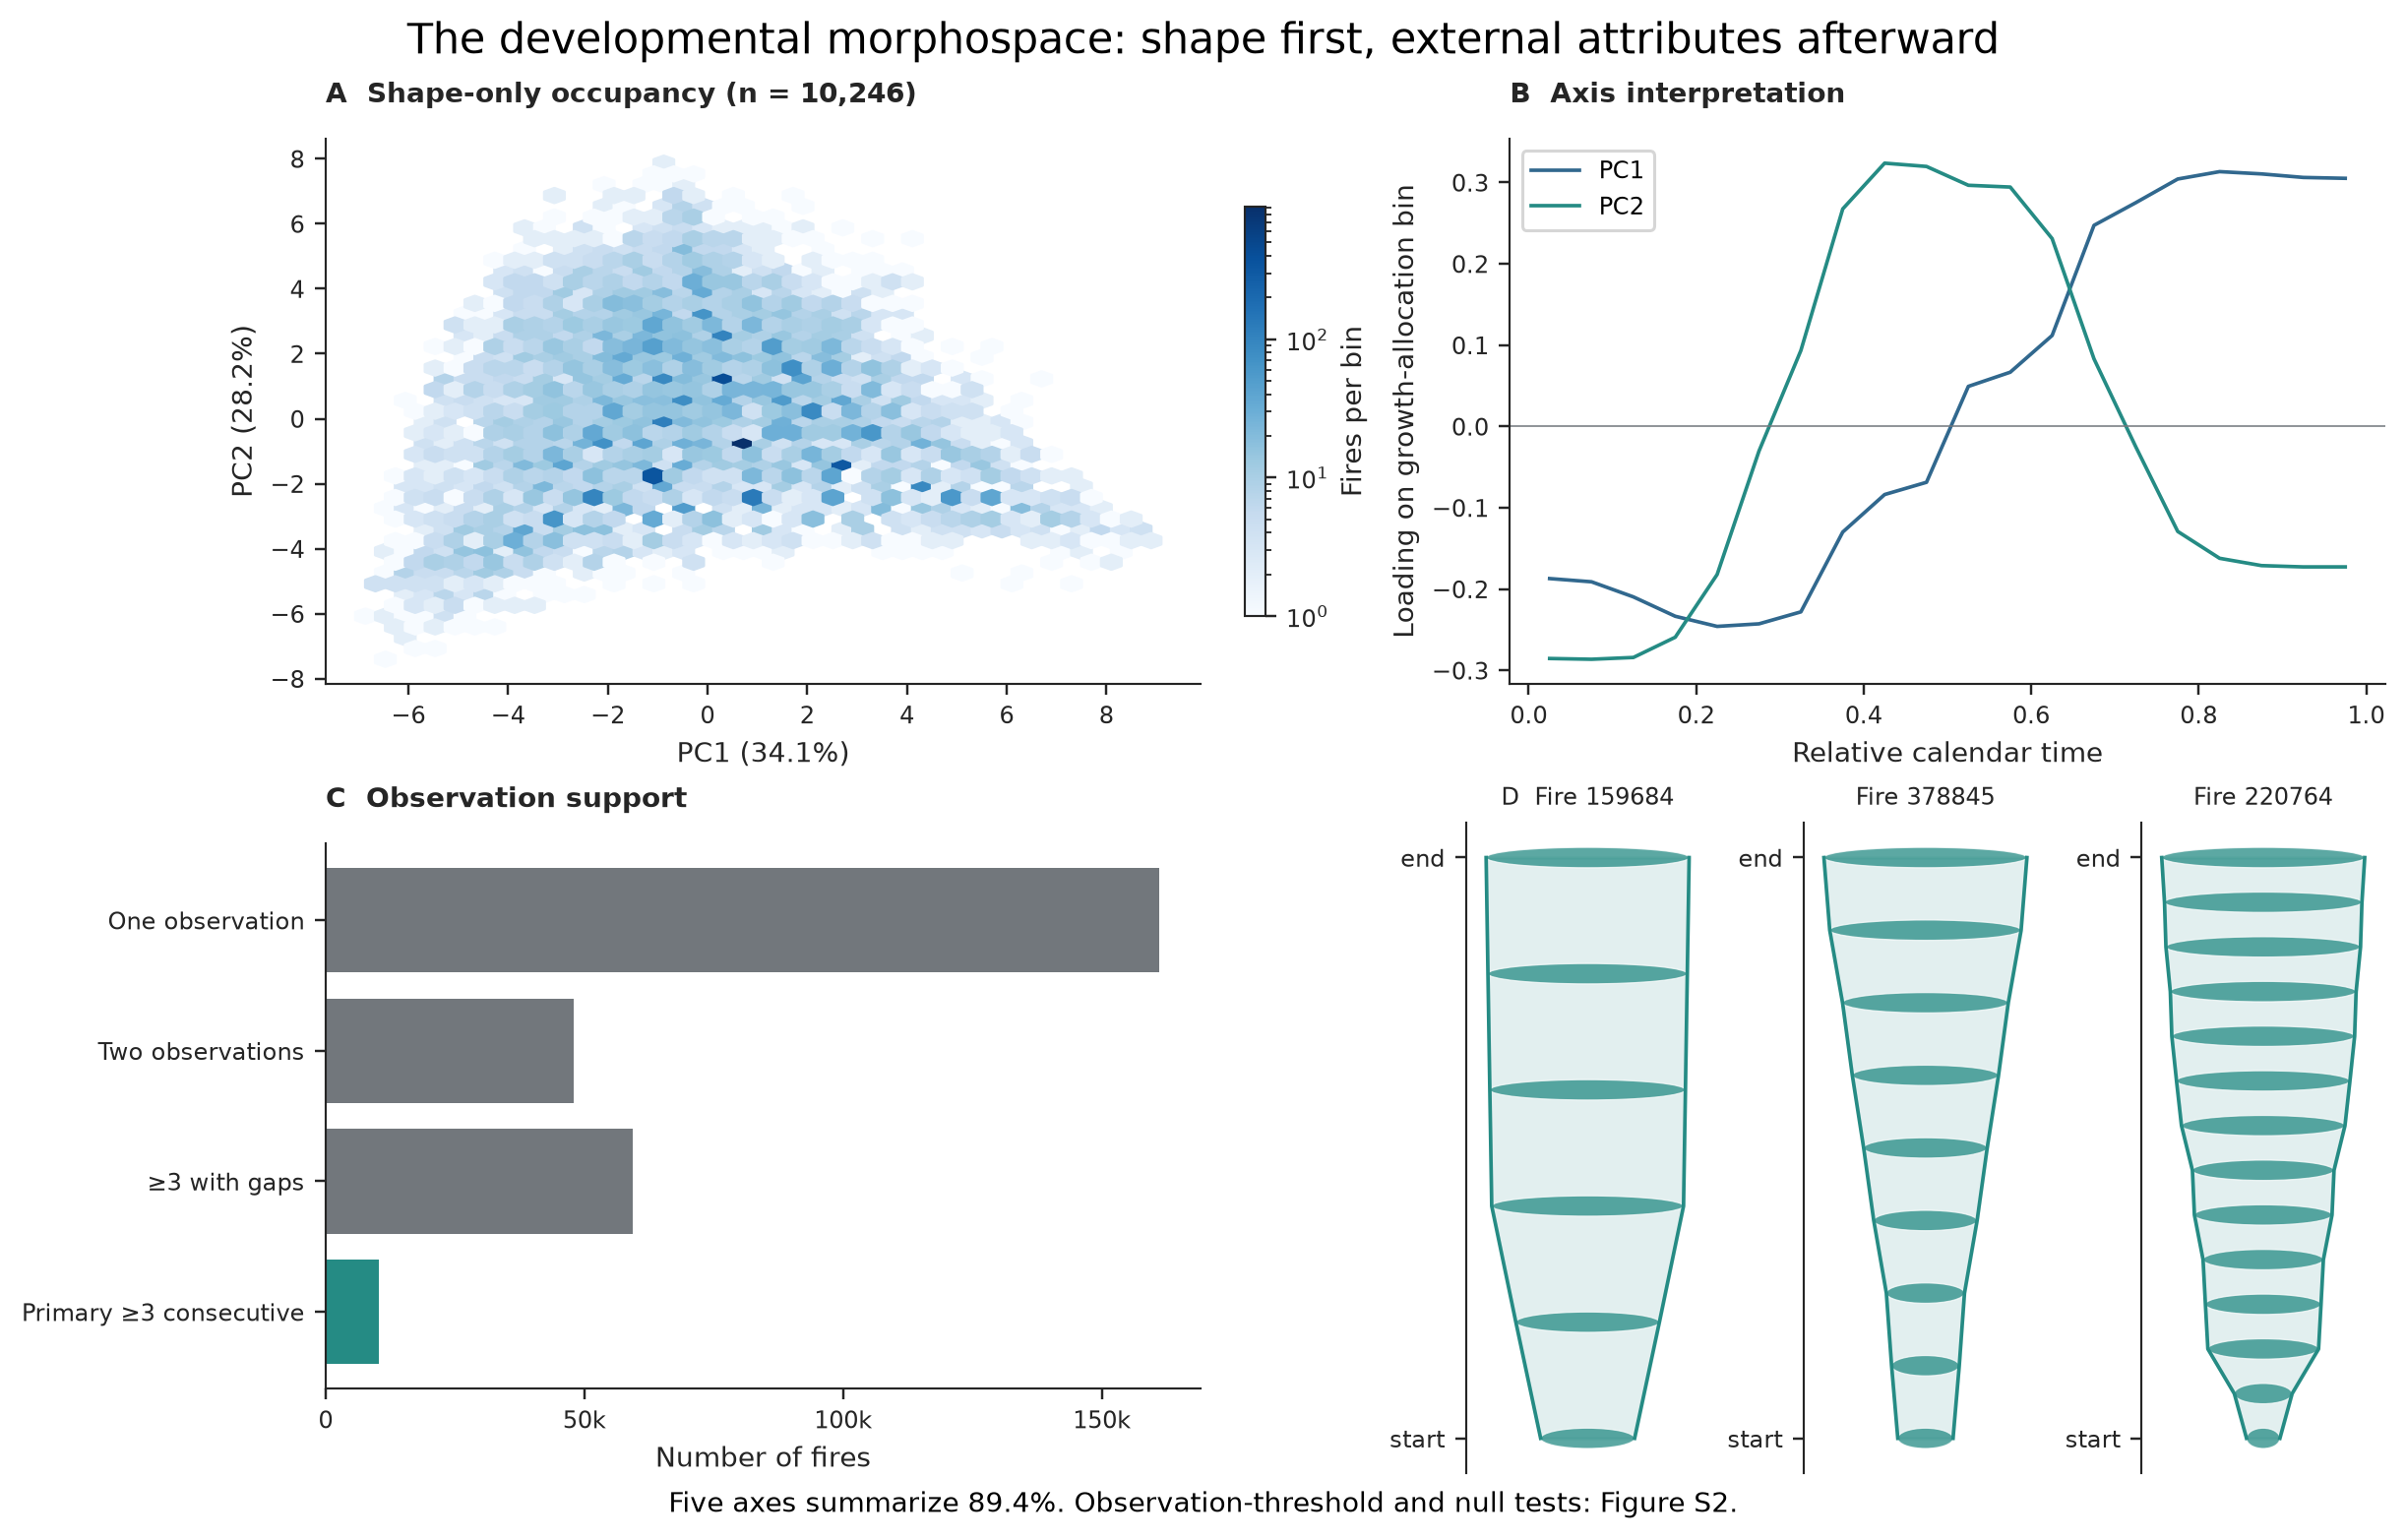
Figure 2. The developmental morphospace. A shape-only coordinate system is fitted from 20 normalized growth-allocation bins for 10,246 gap-free histories. The broad gradients are reproducible, while exact neighbors, extreme examples, and low-dimensional compression require the supplementary qualifications.
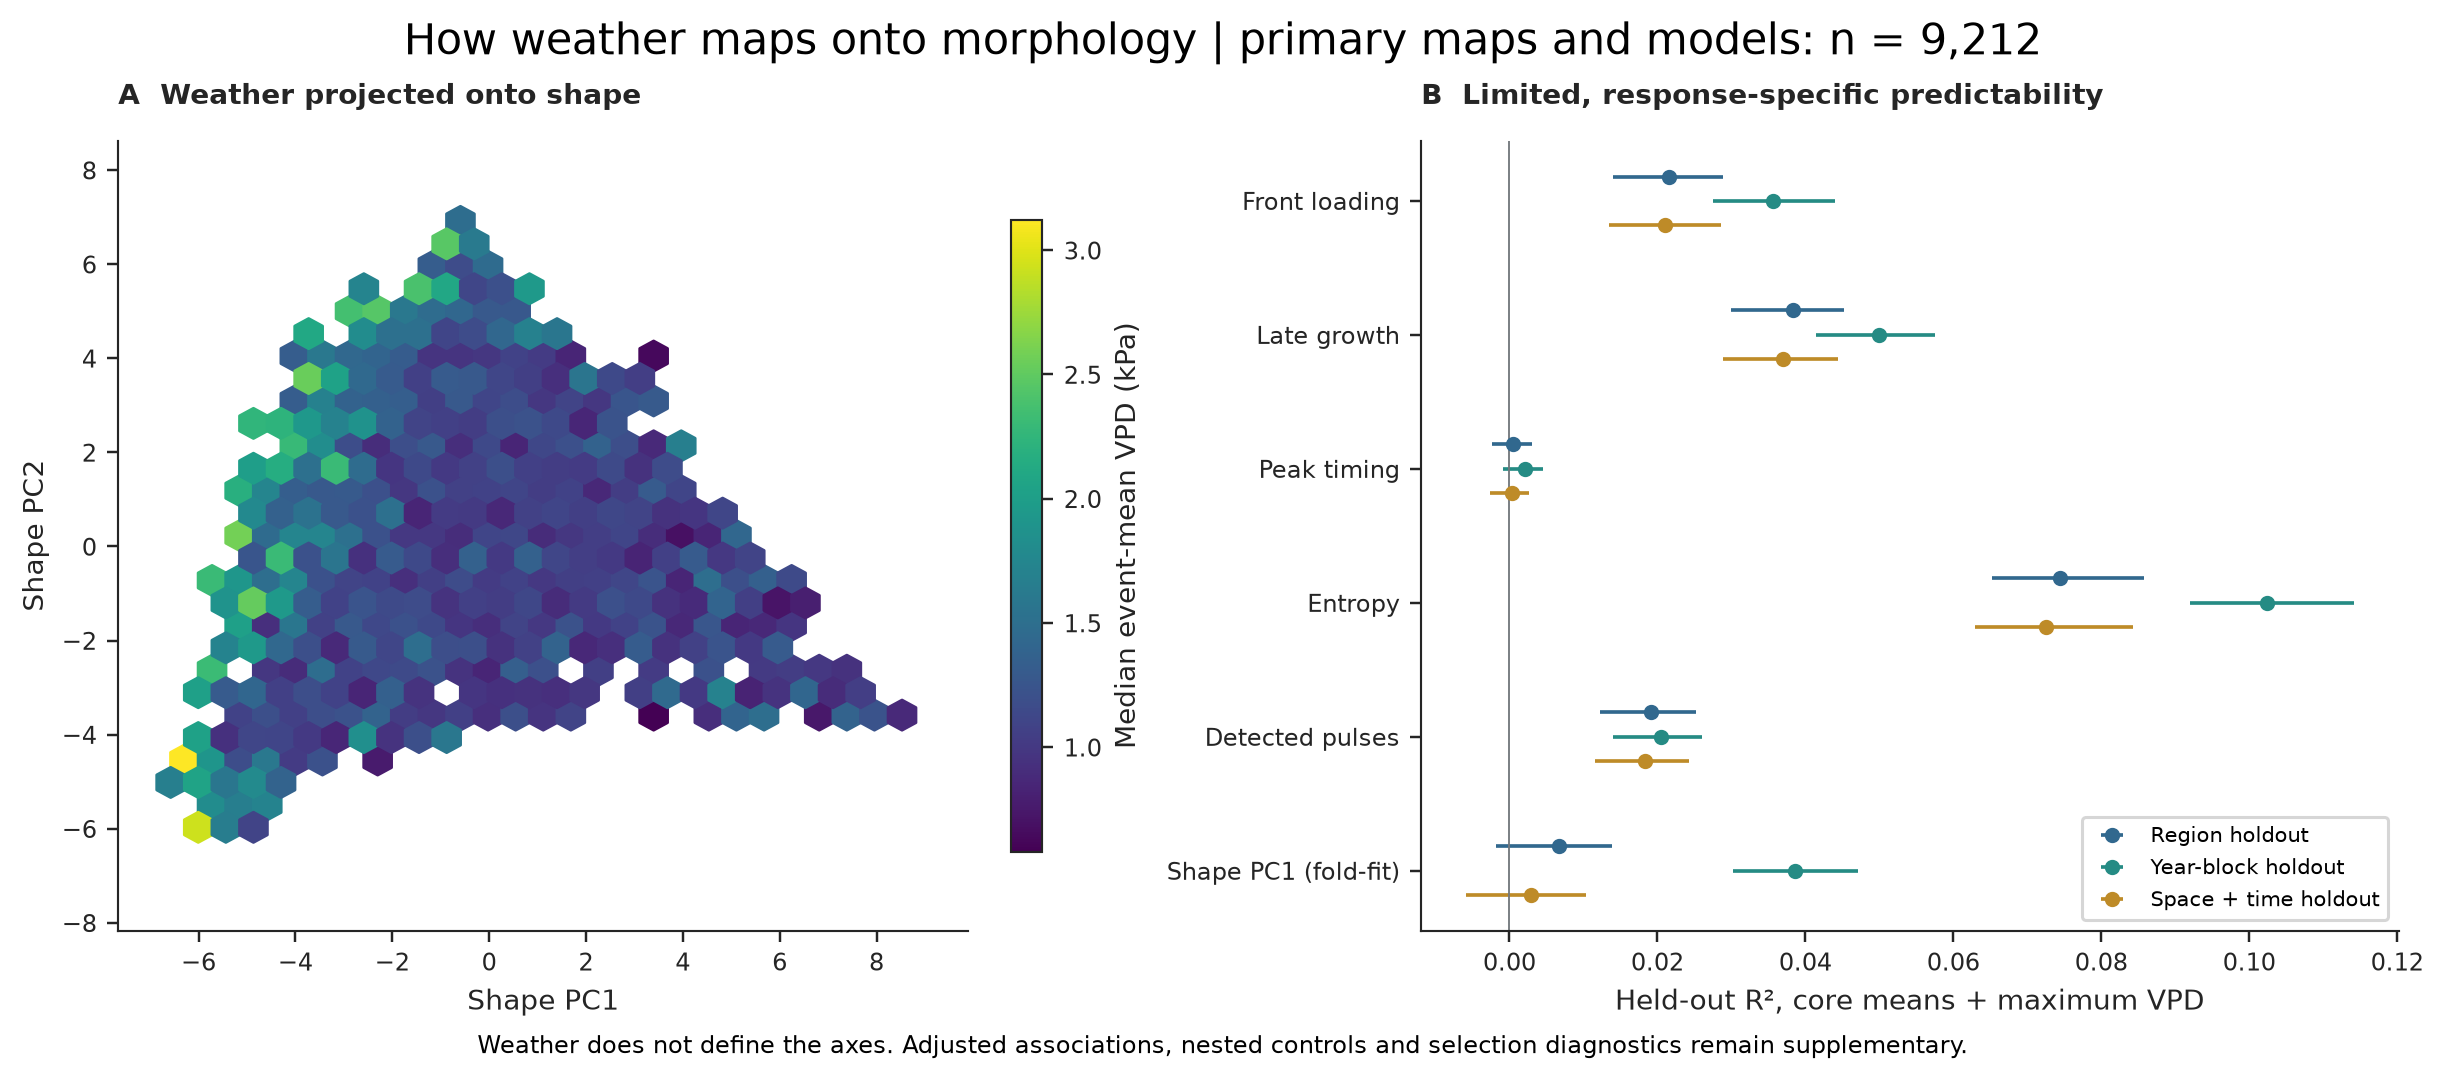
Figure 3. External weather maps weakly and heterogeneously onto developmental morphology. Weather is projected after the axes are fitted. Held-out skill is small and response-dependent across the same 9,212 weather-complete primary fires.
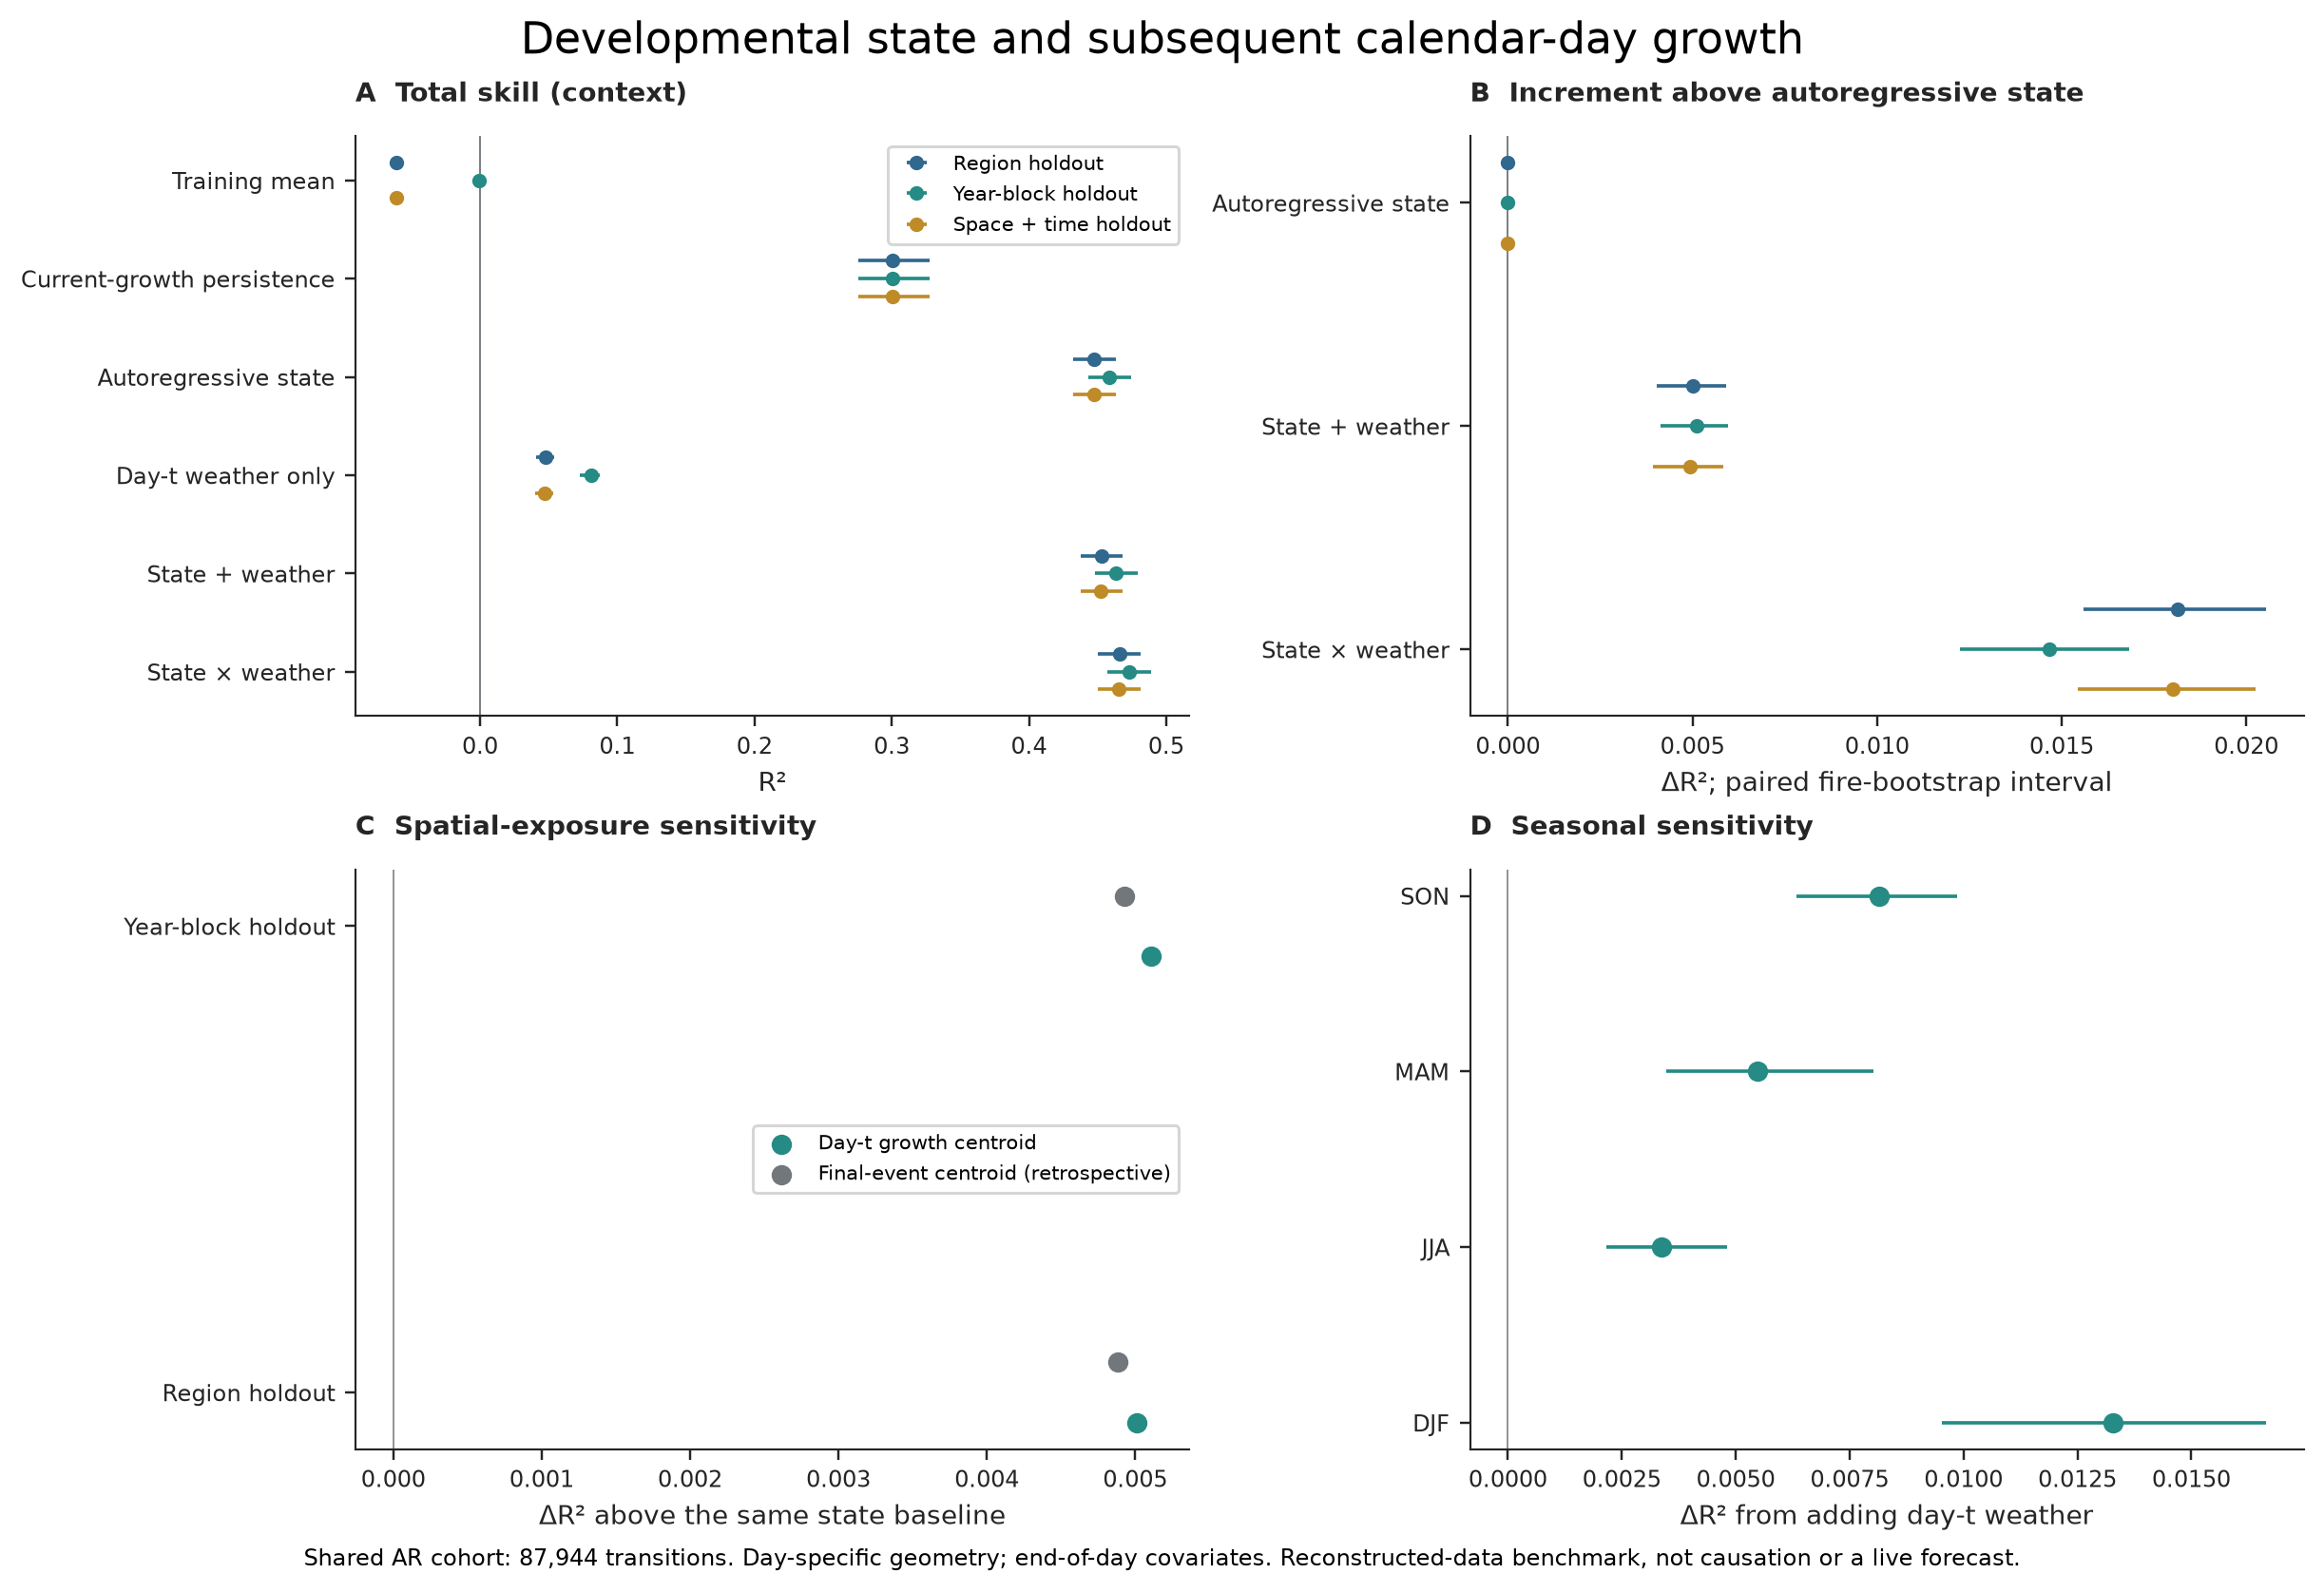
Figure 4. Developmental state and exact subsequent-calendar-day growth. In 87,944 exact next-day transitions, recent fire state provides most predictive information; weather adds a small increment and weather-state interactions add somewhat more. These are retrospective associations, not an operational forecast or causal estimate.
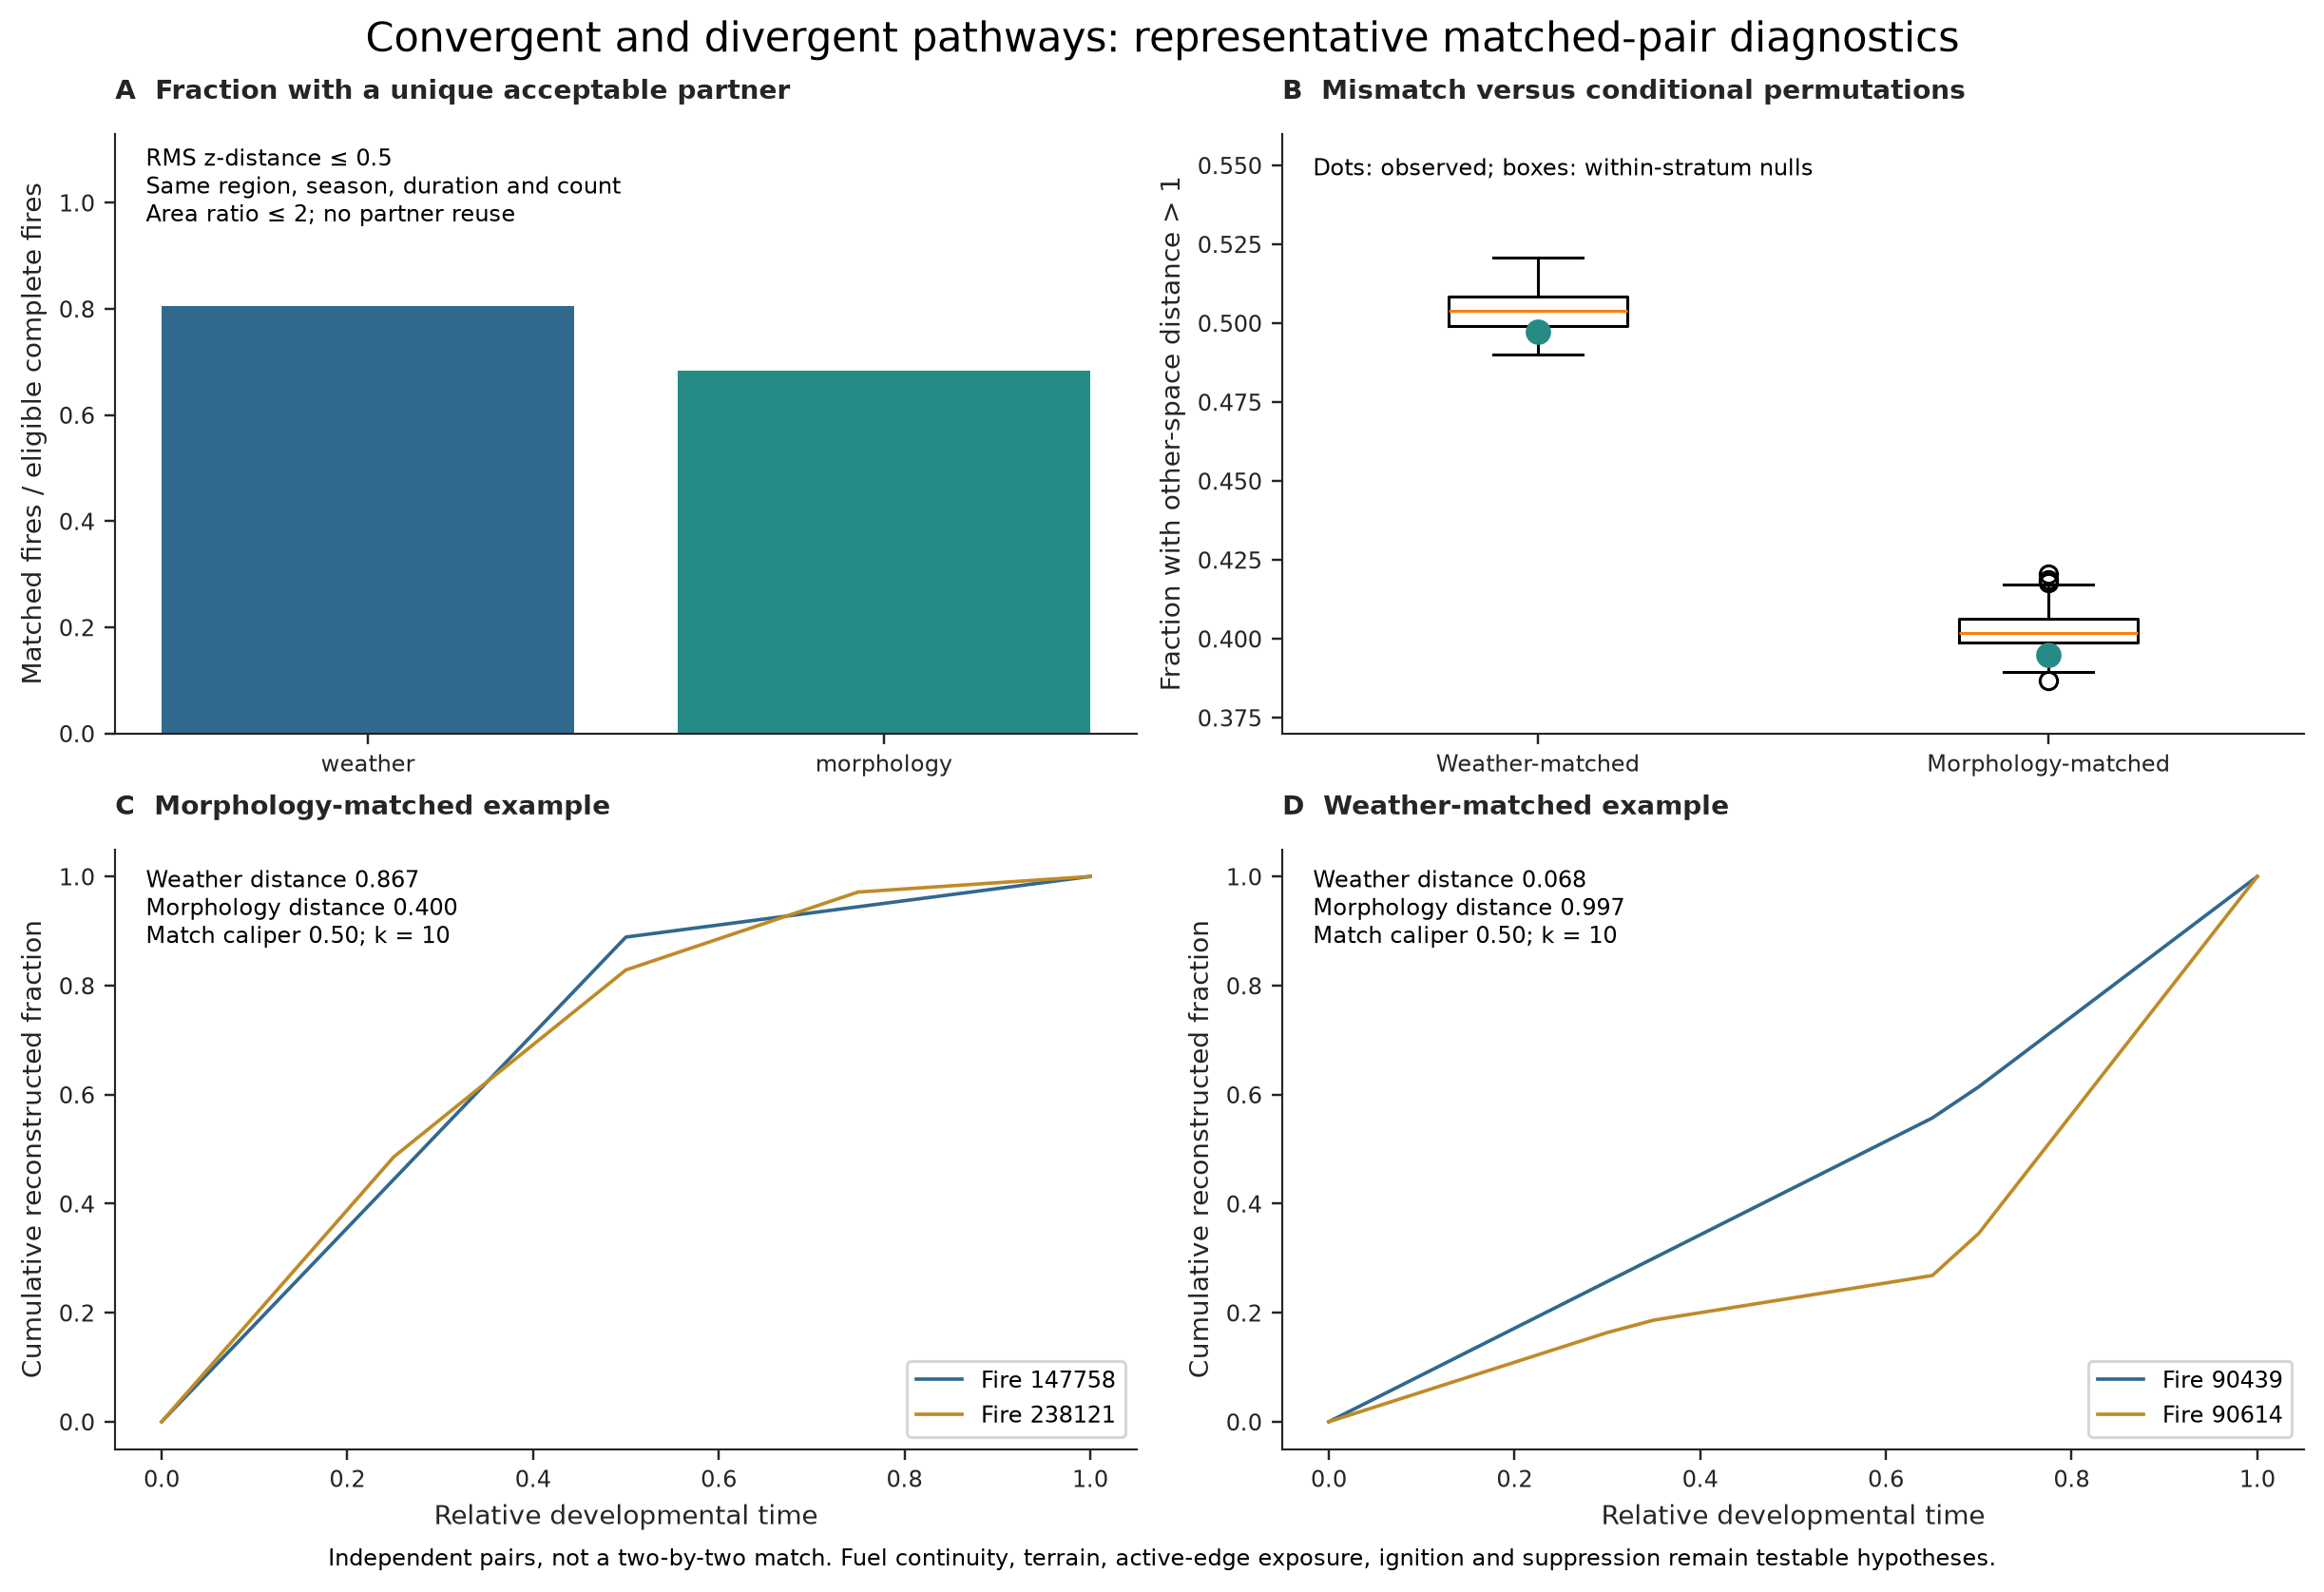
Figure 5. Representative matched-pair diagnostics. Unique, caliper-constrained pairs identify candidate contrasts, but observed mismatch is compatible with the conditional reference distribution. The examples generate hypotheses; they do not identify omitted mechanisms.
Current supplementary figures
The supplement carries the full model grid, observation-support and null tests, VPD interaction diagnostics, and compositional-geometry sensitivity.
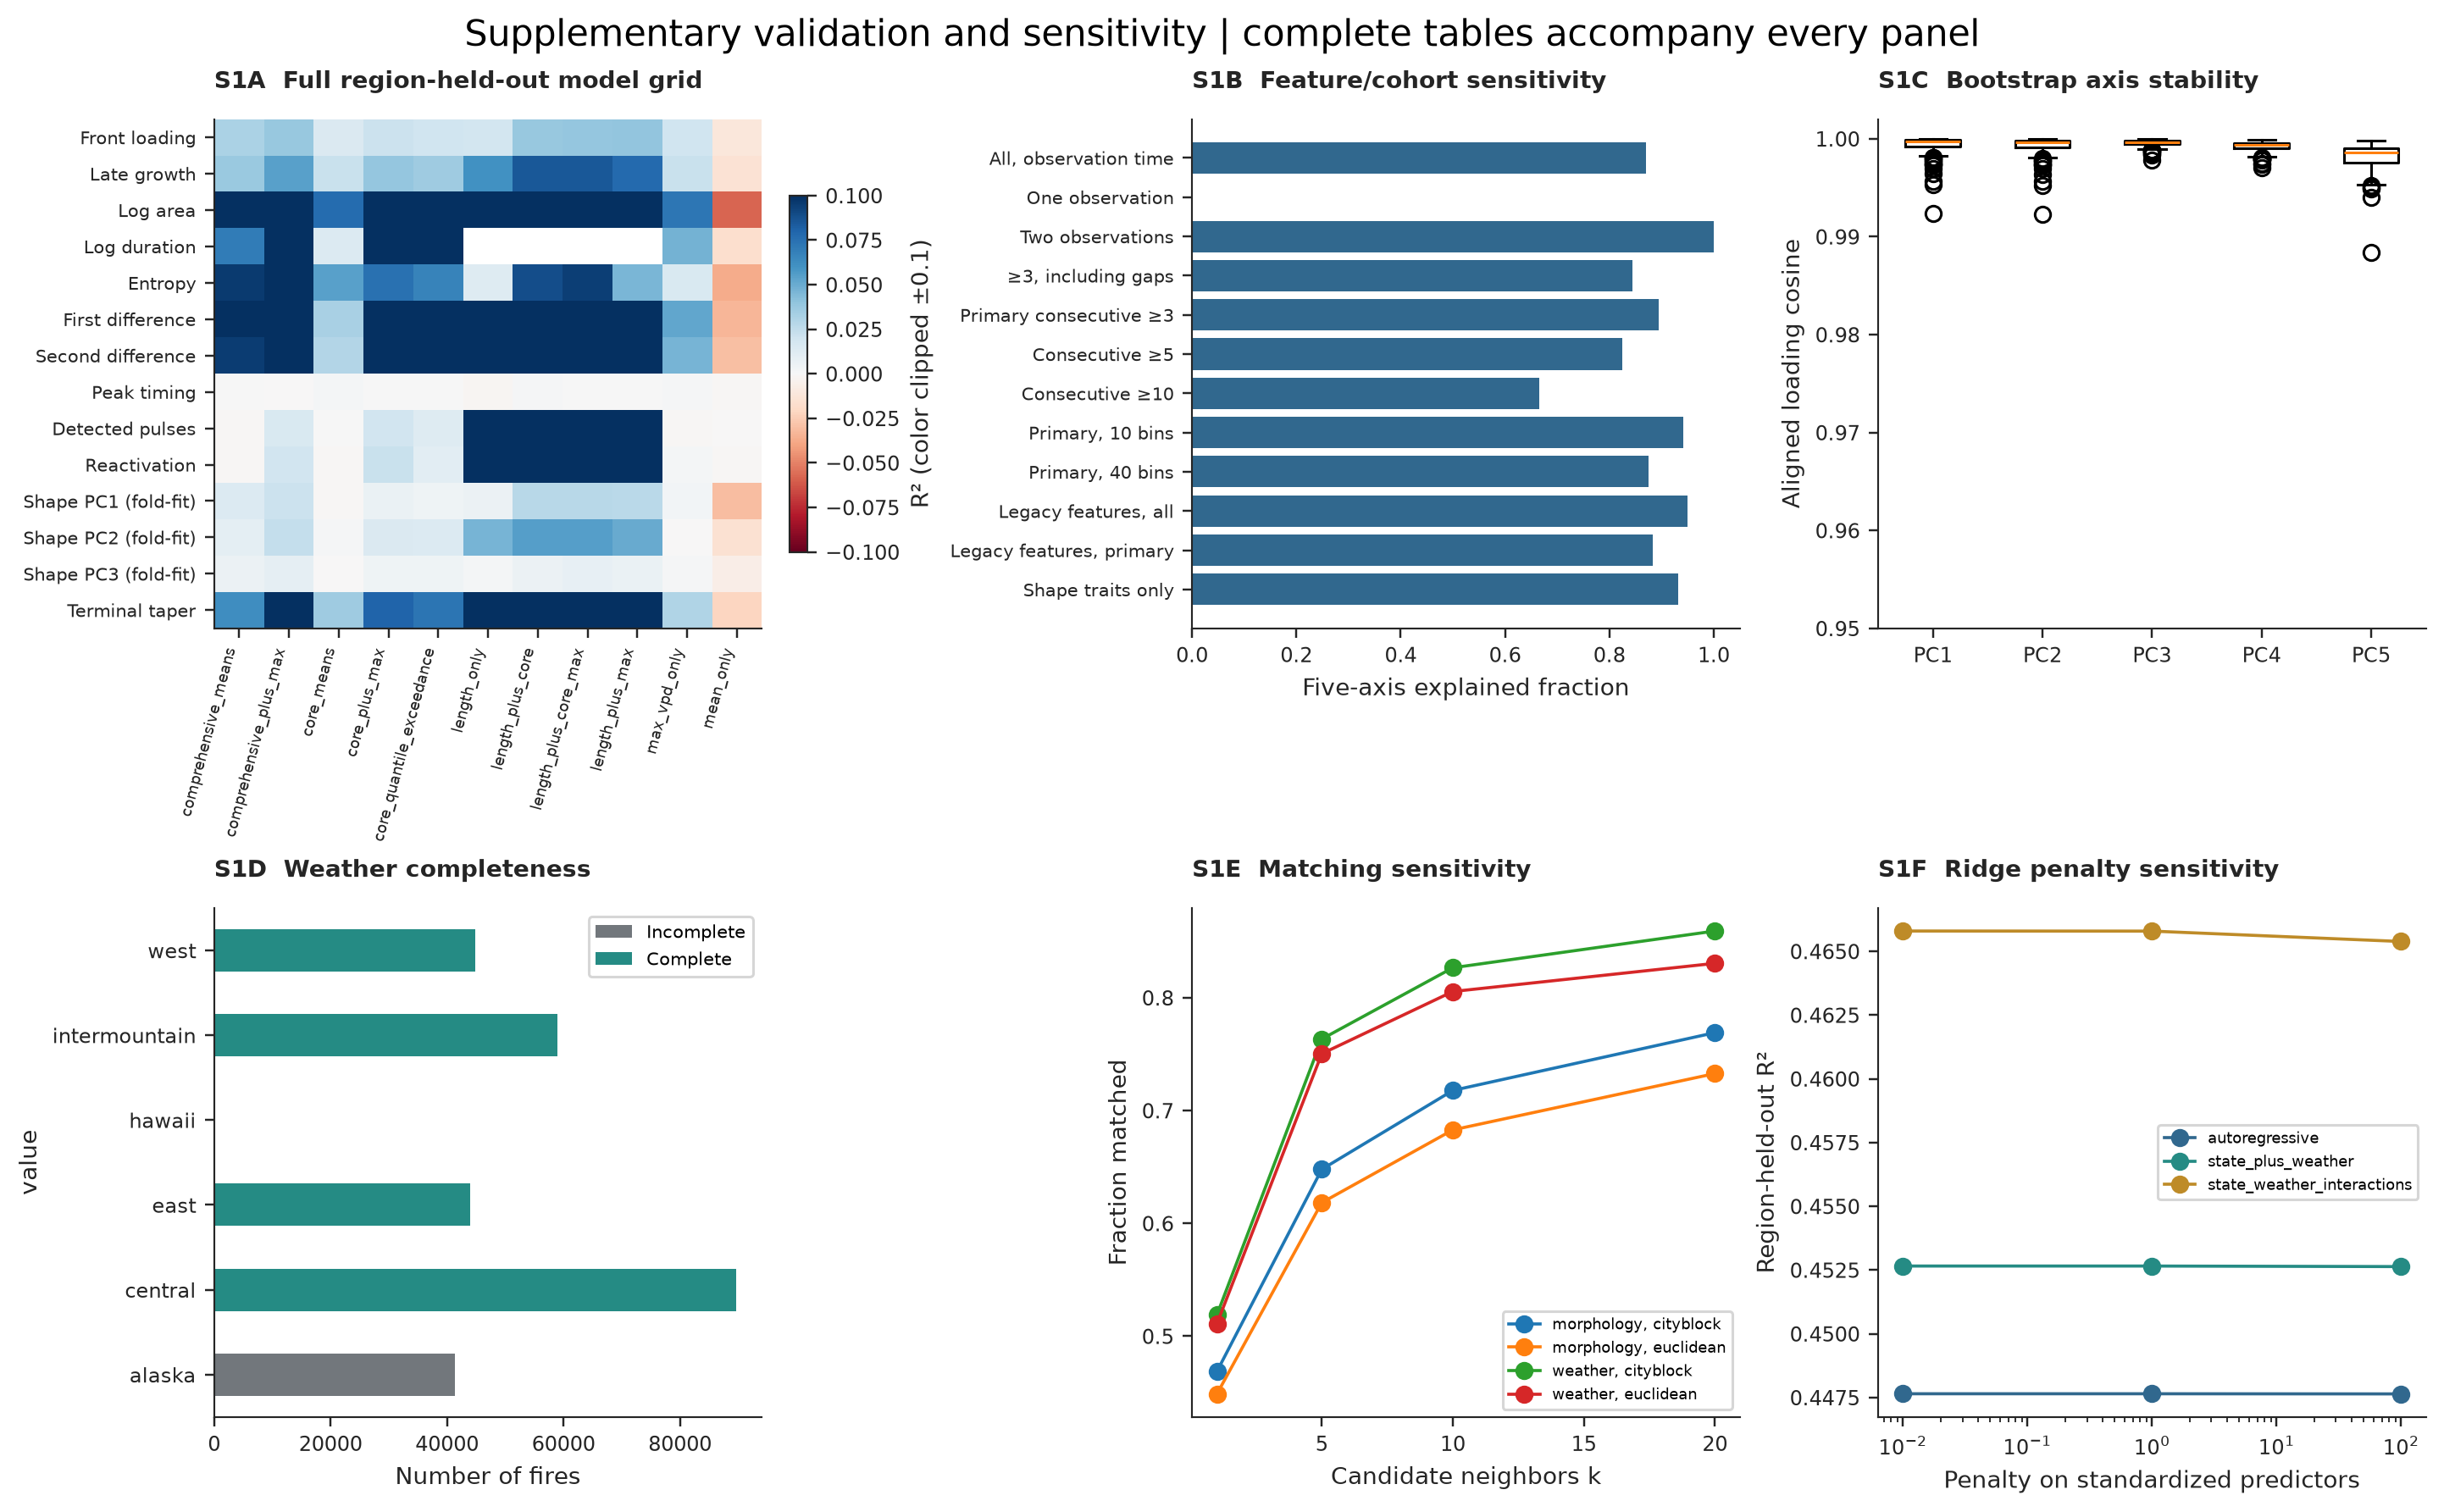
Figure S1. Complete validation and sensitivity diagnostics. Regional model performance, feature/cohort sensitivity, bootstrap loading stability, weather completeness, matching sensitivity, and state-model penalties are shown with machine-readable tables available in the repository.
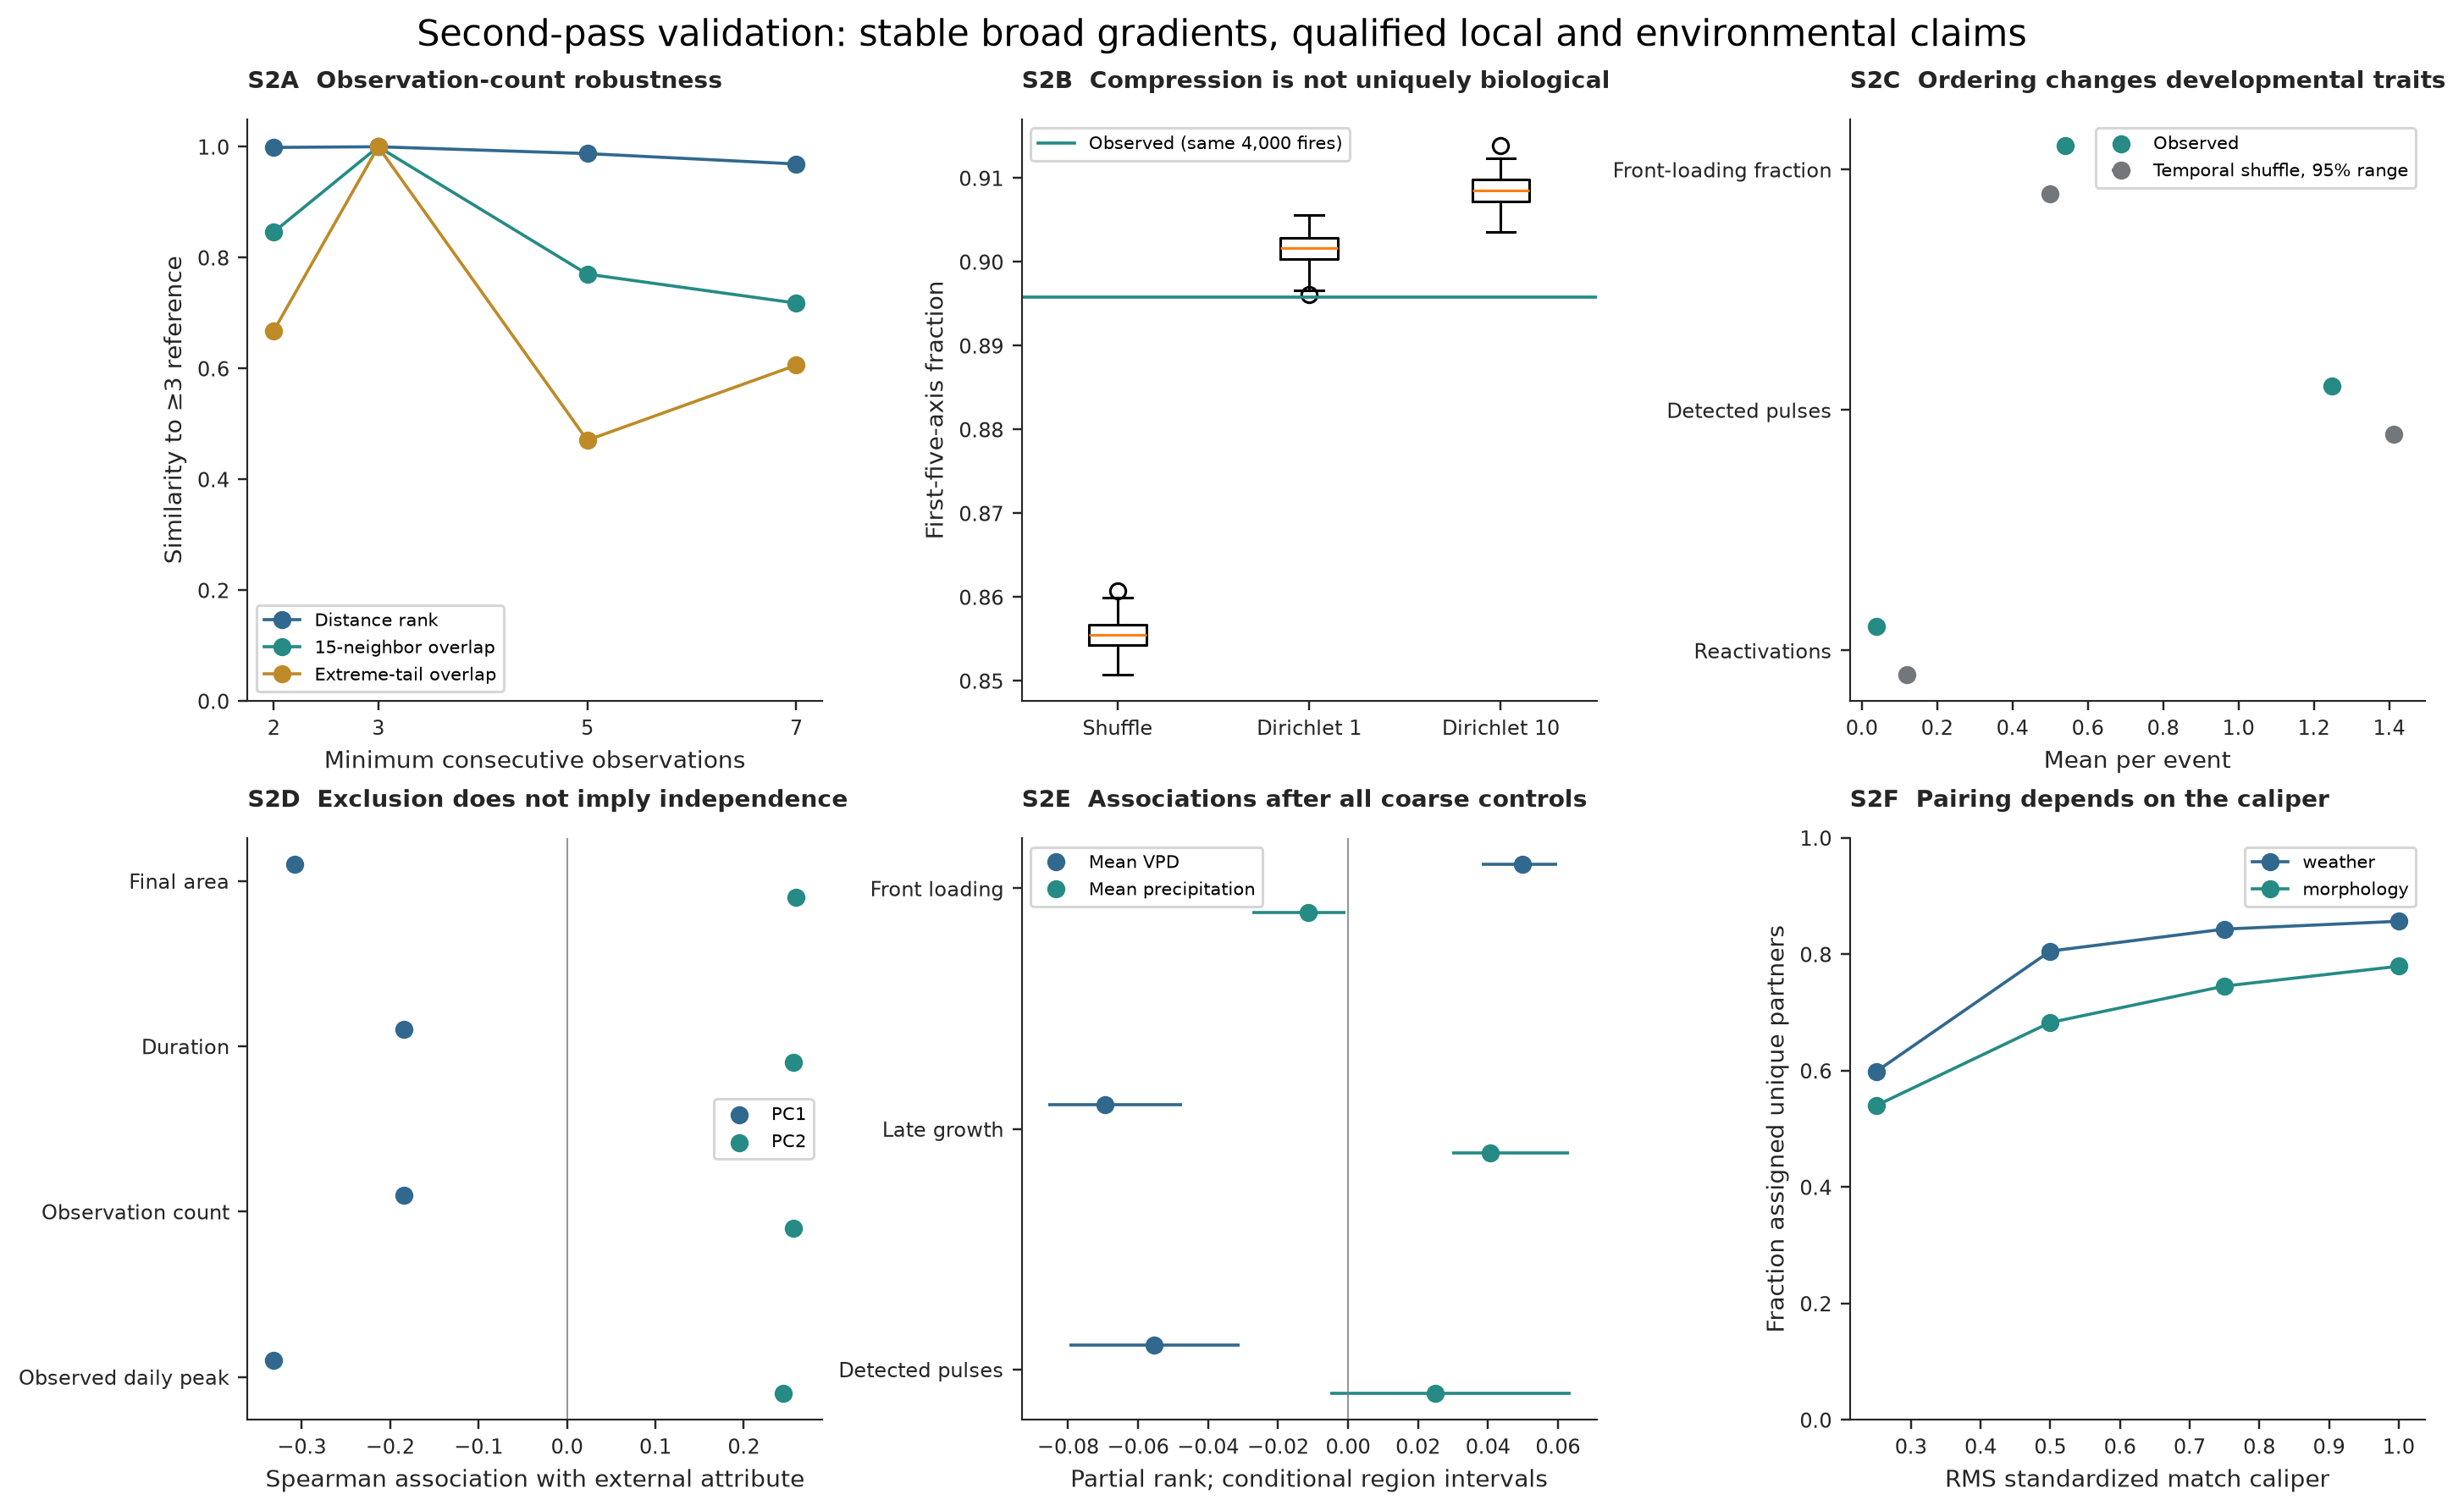
Figure S2. Robustness of developmental morphology and limits of external interpretation. Observation-depth, allocation-null, temporal-order, endpoint, adjusted-weather, and matching-caliper tests distinguish stable broad gradients from less stable local structure and qualified external associations.
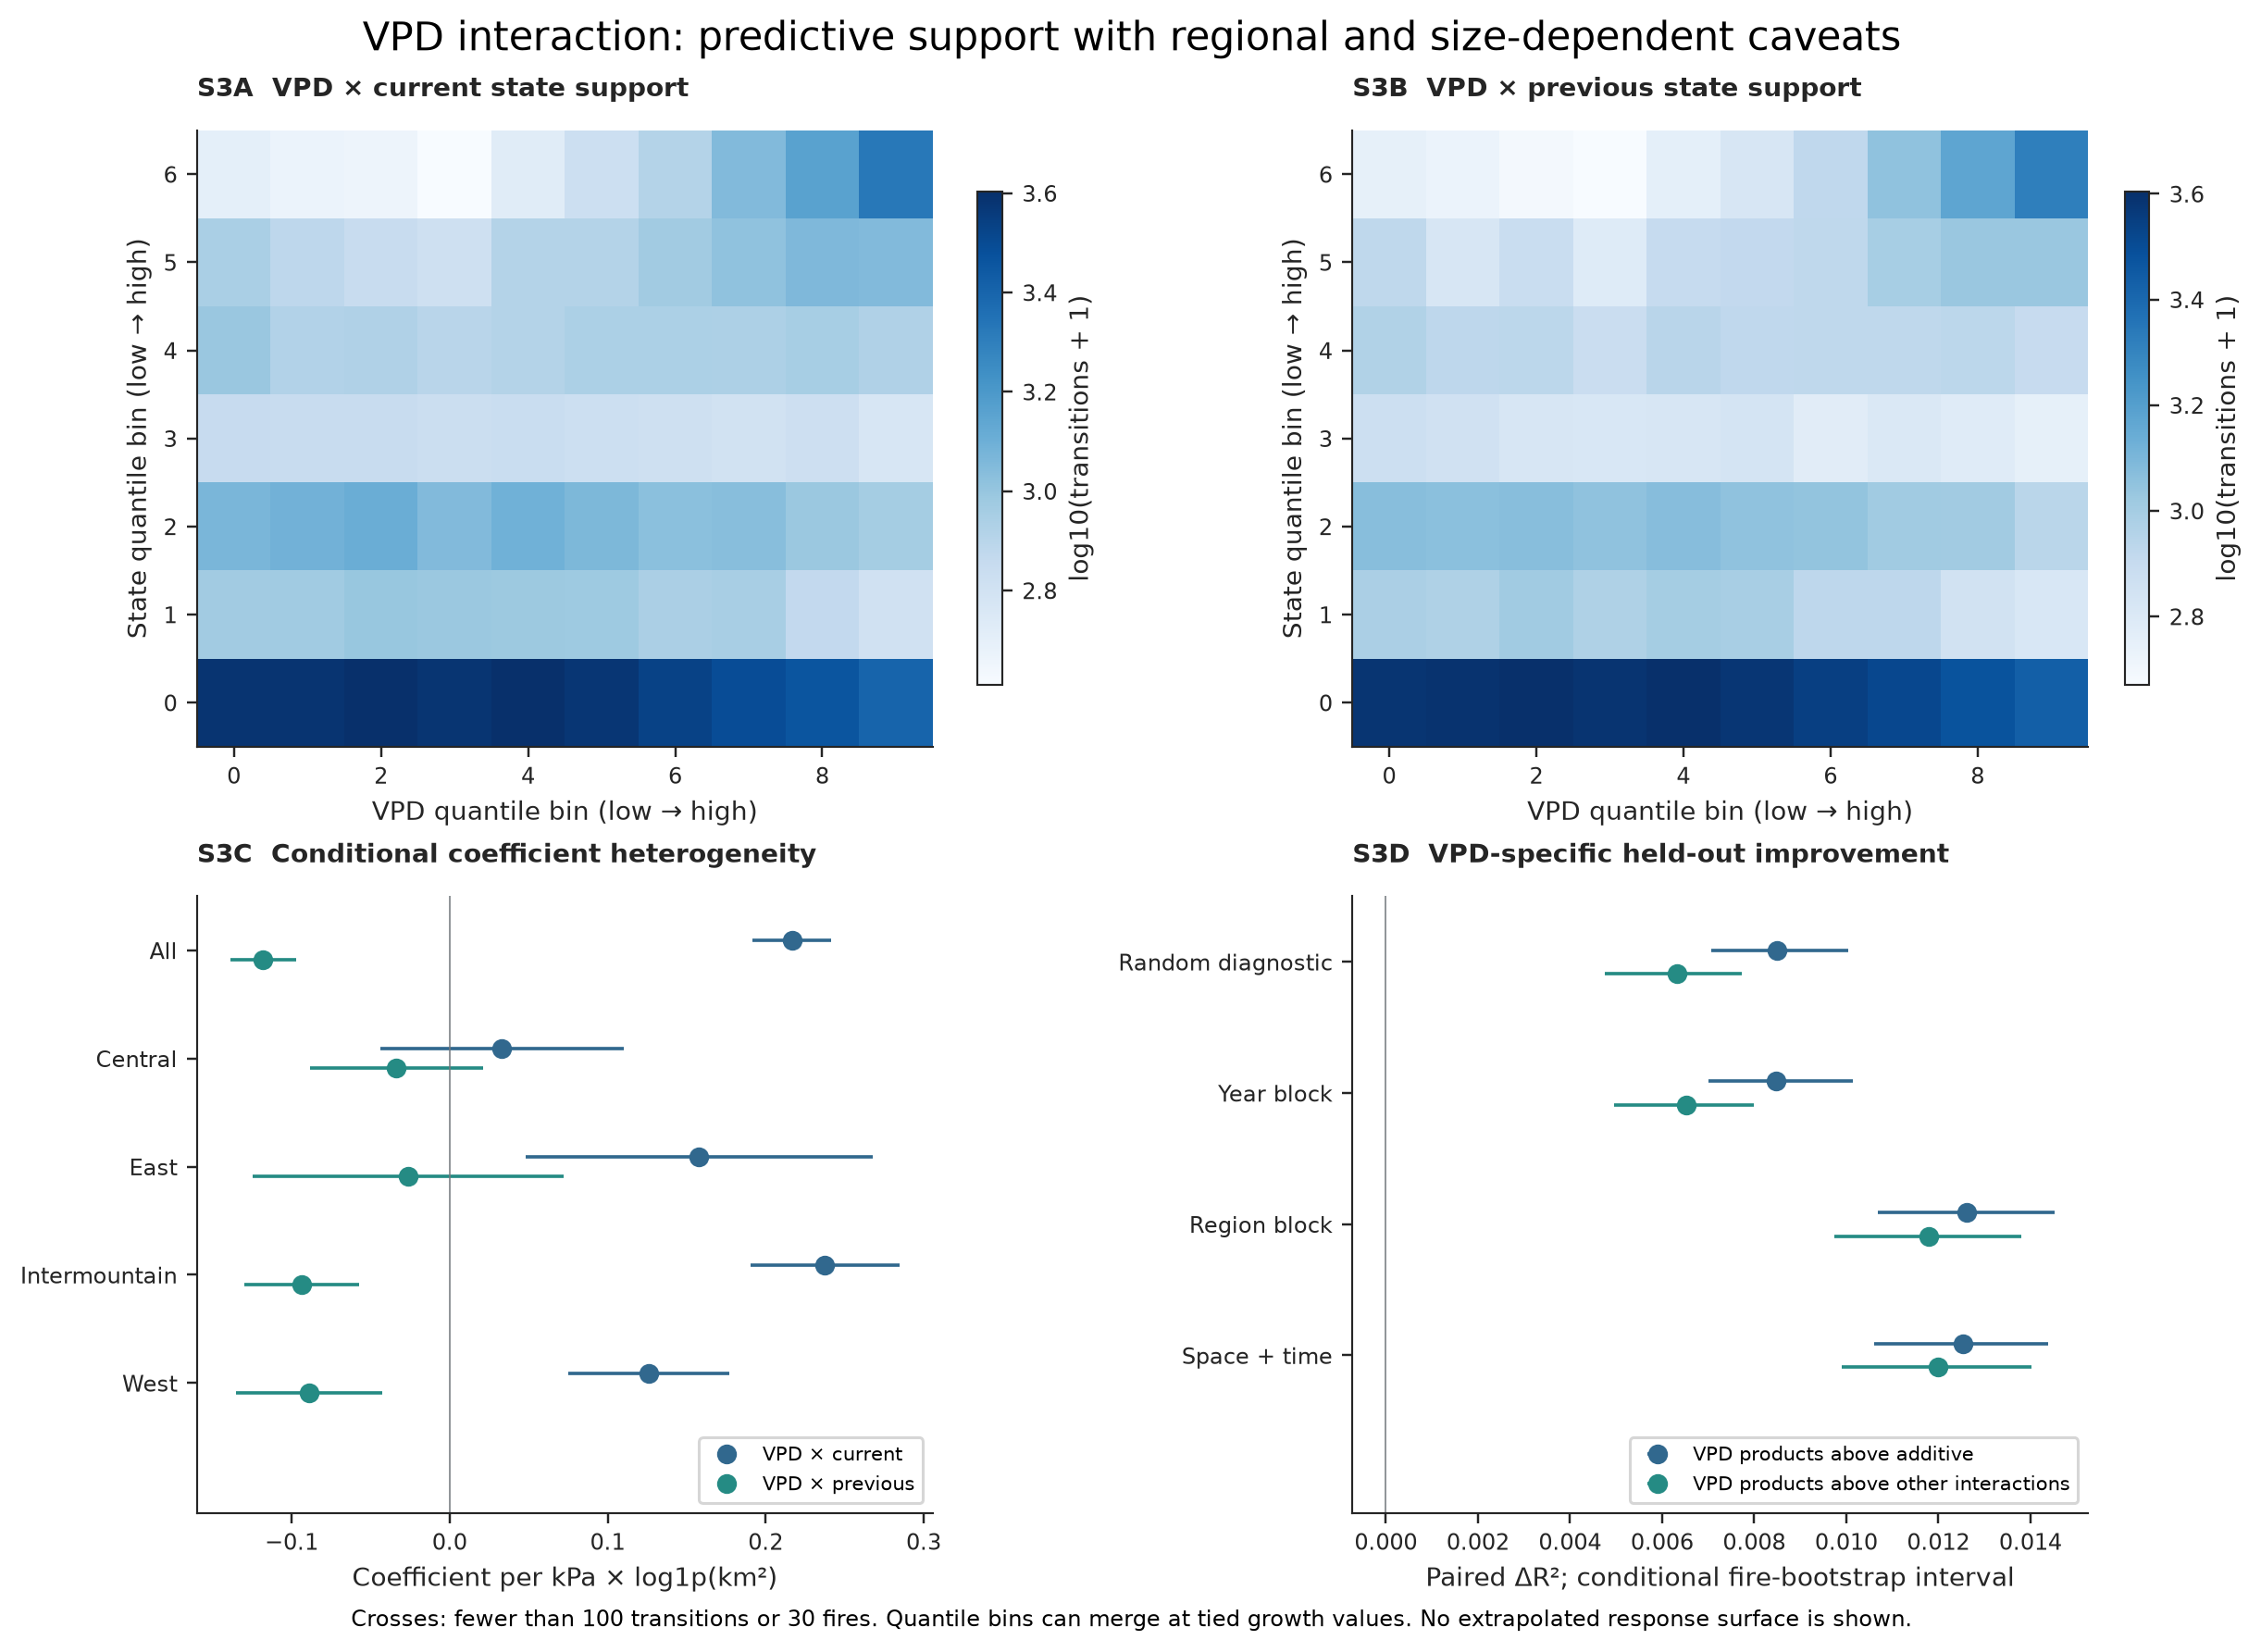
Figure S3. Data support and heterogeneity of VPD-state interactions. Joint support, original-unit coefficients, regional refits, and held-out ablations show a positive average contribution with enough heterogeneity to rule out a universal response curve.
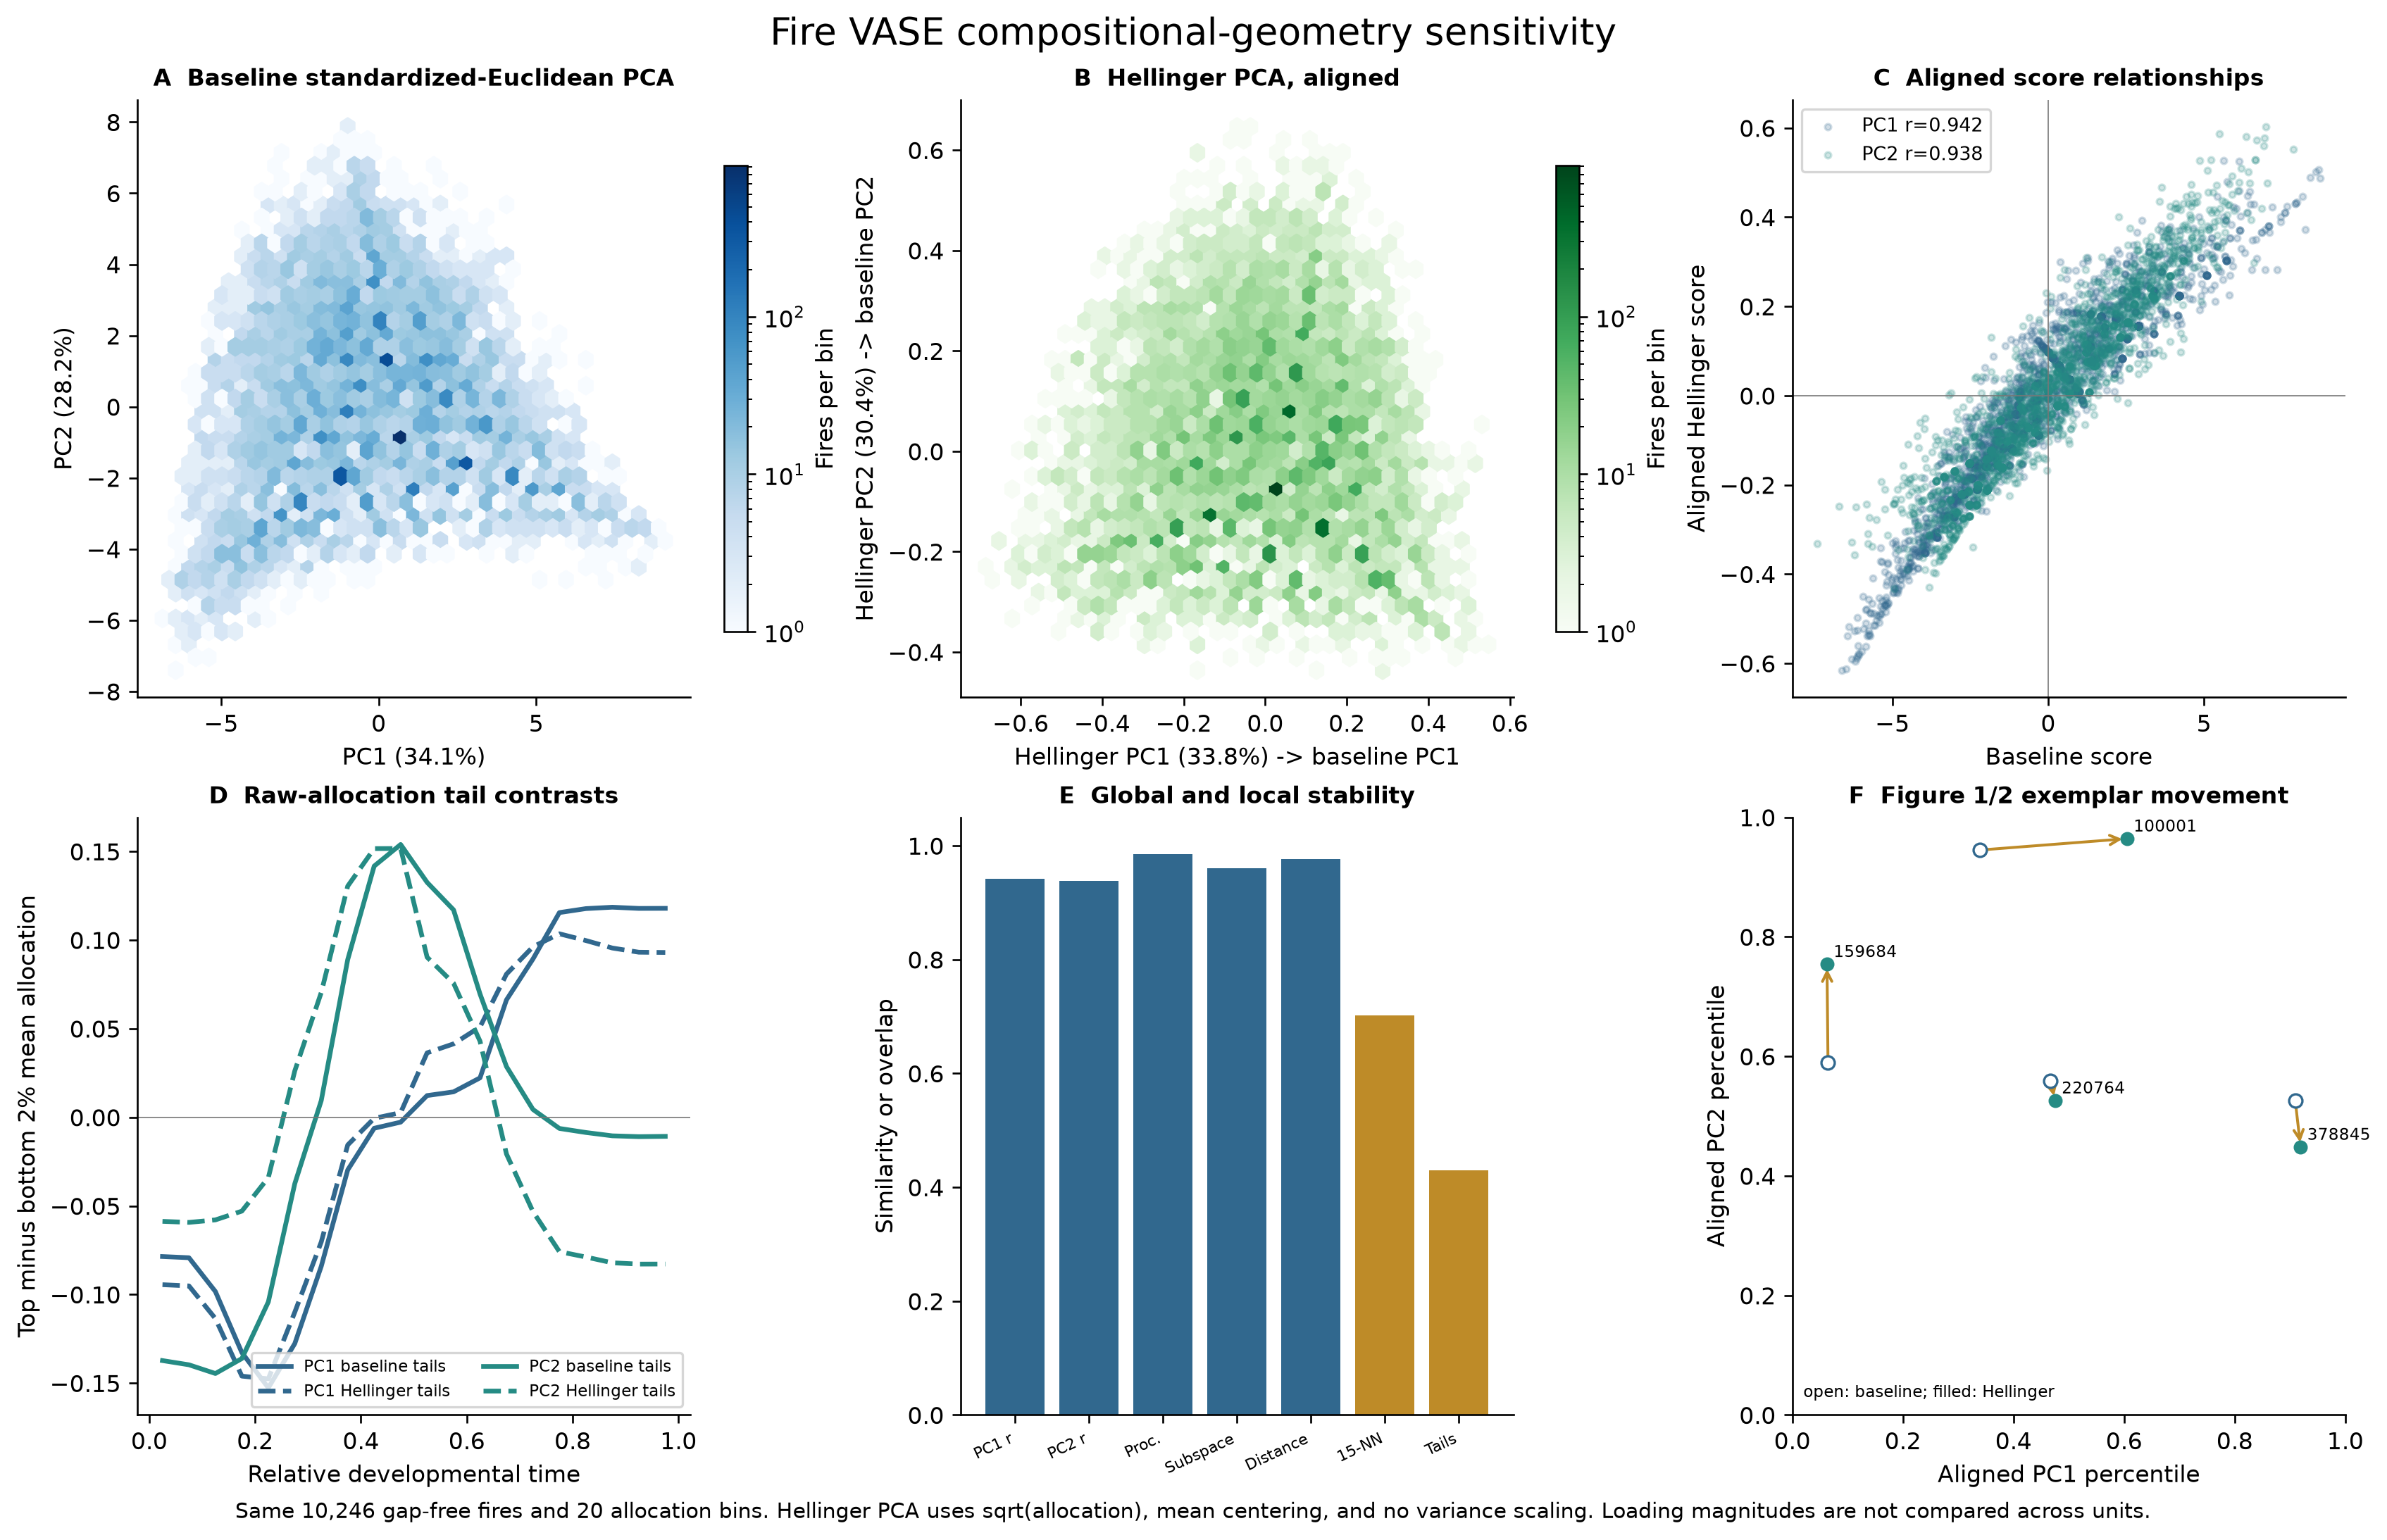
Figure S4. Compositional-geometry sensitivity of the developmental morphospace. The dominant early-versus-late gradient and broad configuration persist under Hellinger geometry, while neighborhood membership, extreme exemplars, and the secondary contrast are less invariant.
Additional adversarial validation
This six-panel check supports the current wording but is not a numbered submission figure.
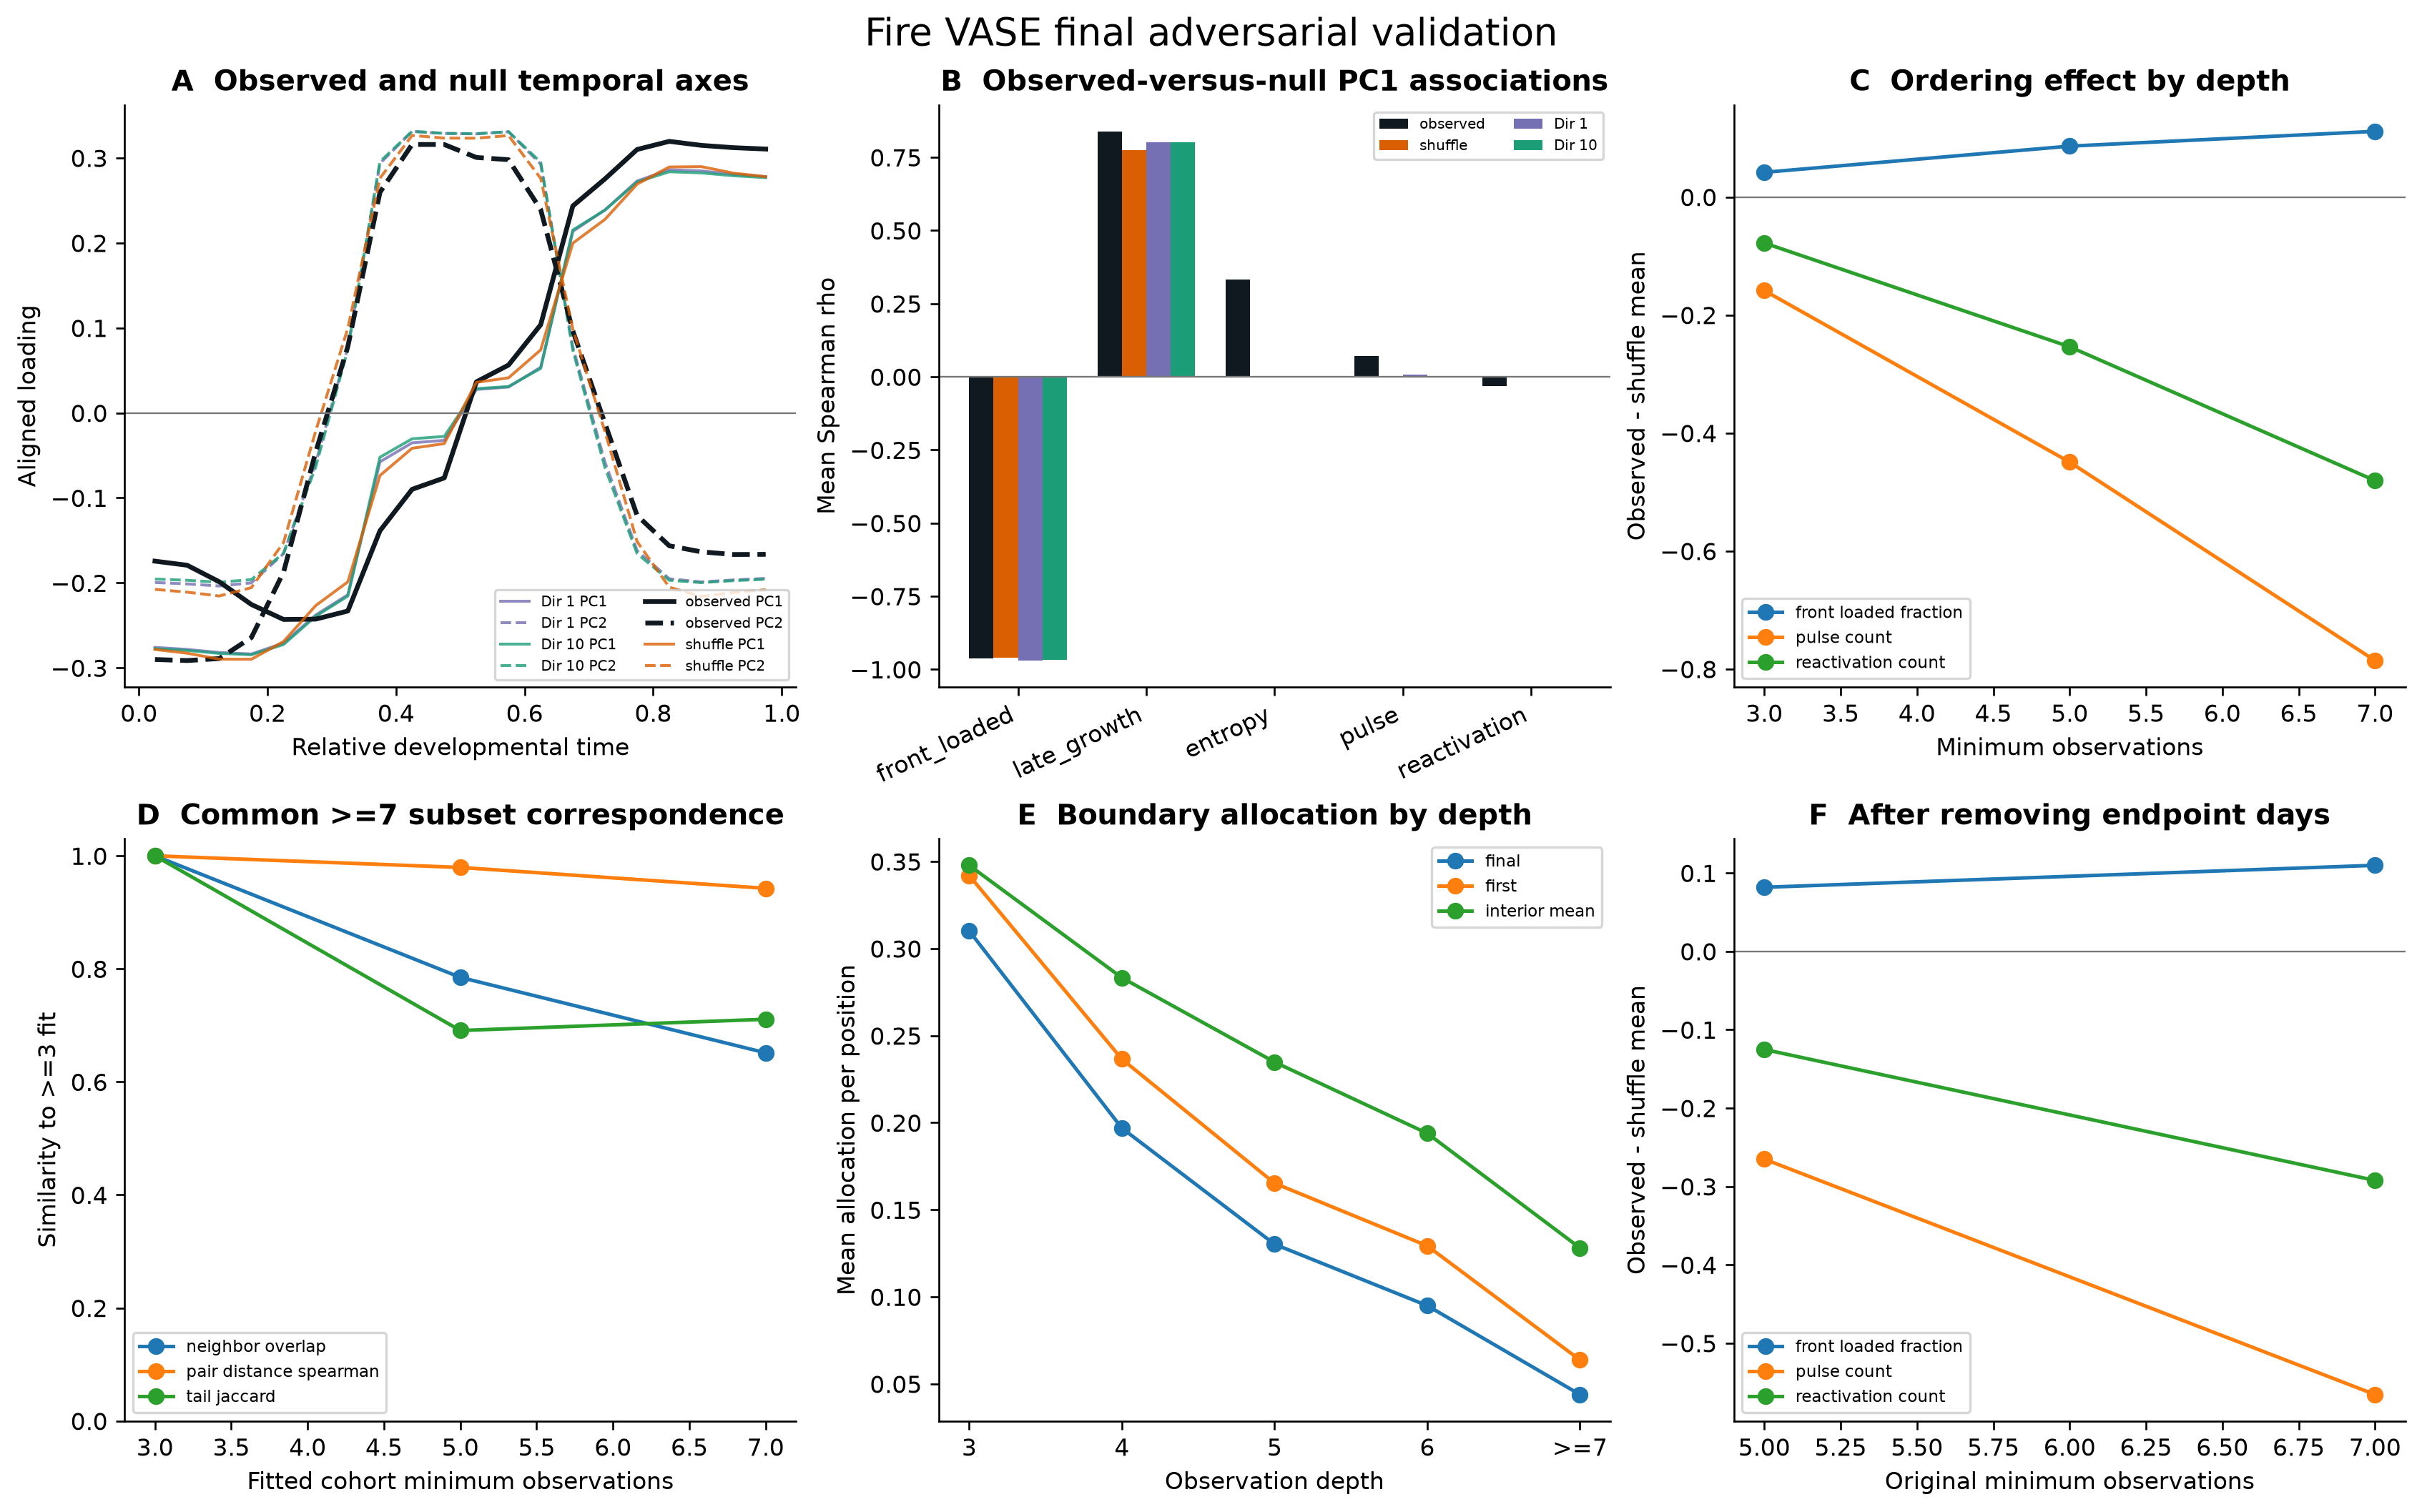
Final adversarial validation. Positive mass-conserving null histories also compress, so compression alone is not evidence of biological restriction. Observed ordering effects retain their direction at stricter observation depths and after excluding boundary days.
Historical main figures
These are the earlier climate-revision figures. They are shown in full for review and provenance, but the corrected v2 figures above supersede their quantitative interpretations. In particular, the historical 0.349 aggregated weather-performance headline is withdrawn.
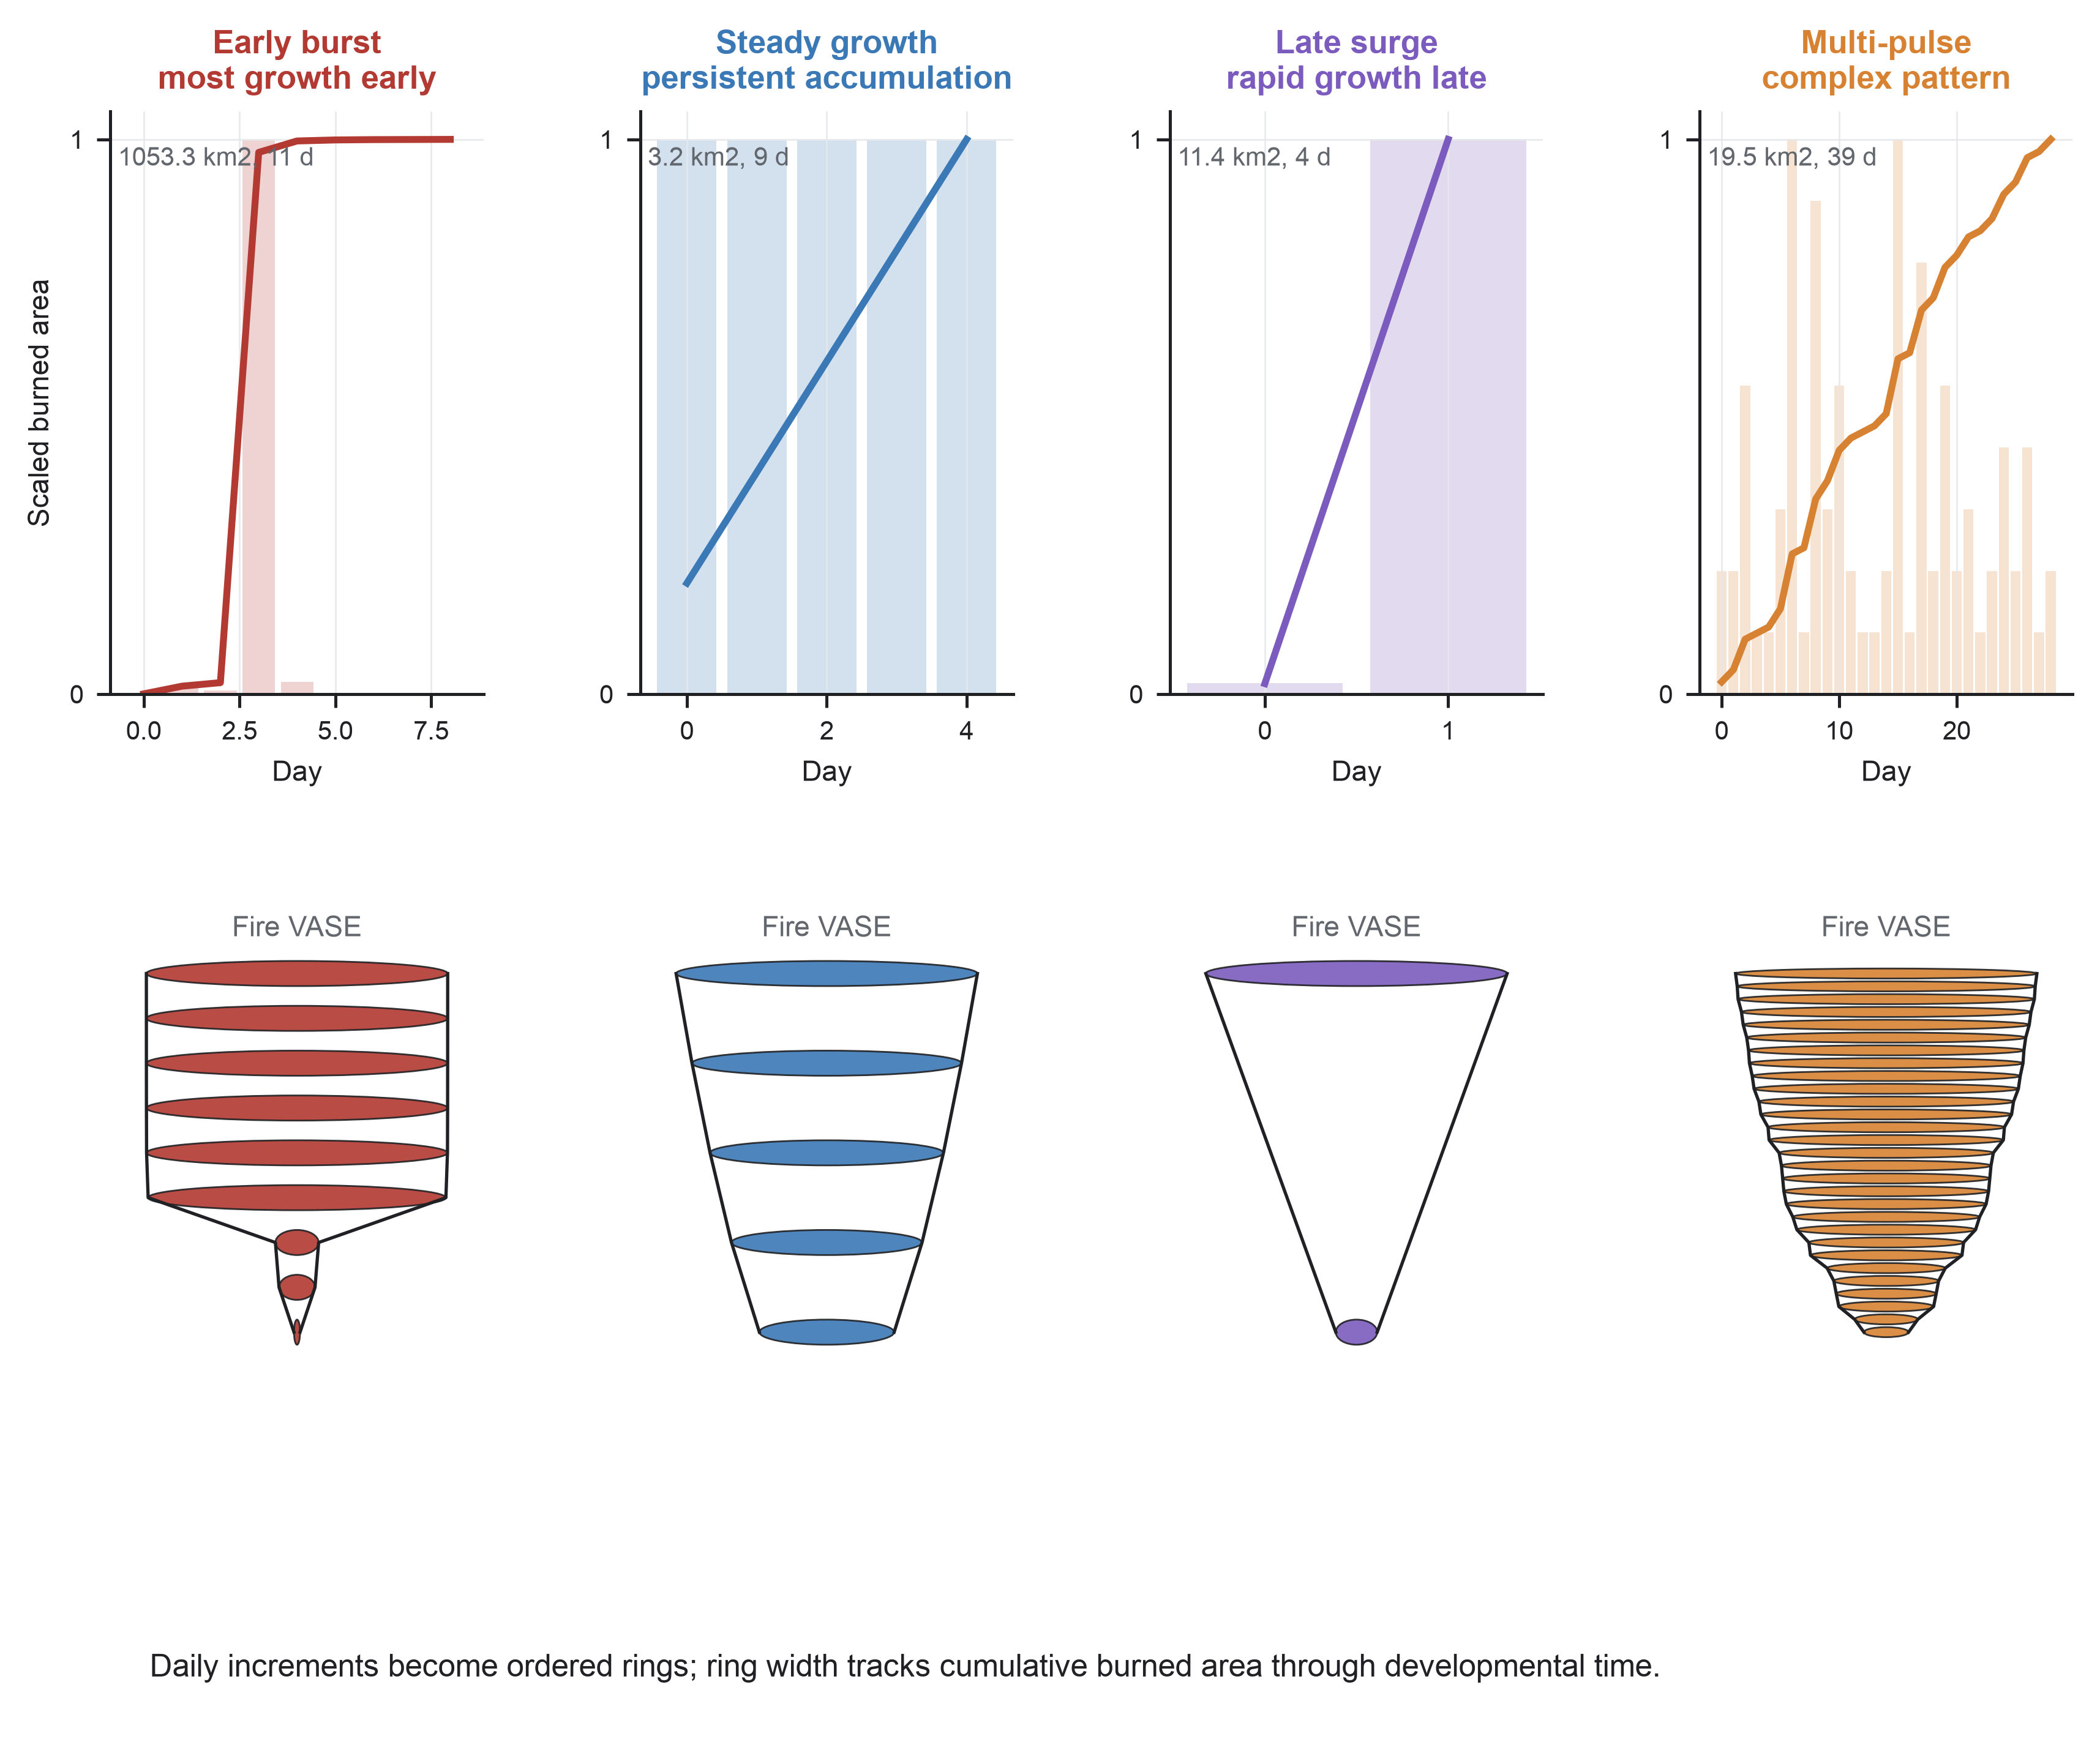
Figure 1. Fire VASE preserves developmental differences hidden by final outcomes. Four observed FIRED events show why final burned area and duration are insufficient descriptions of wildfire development.
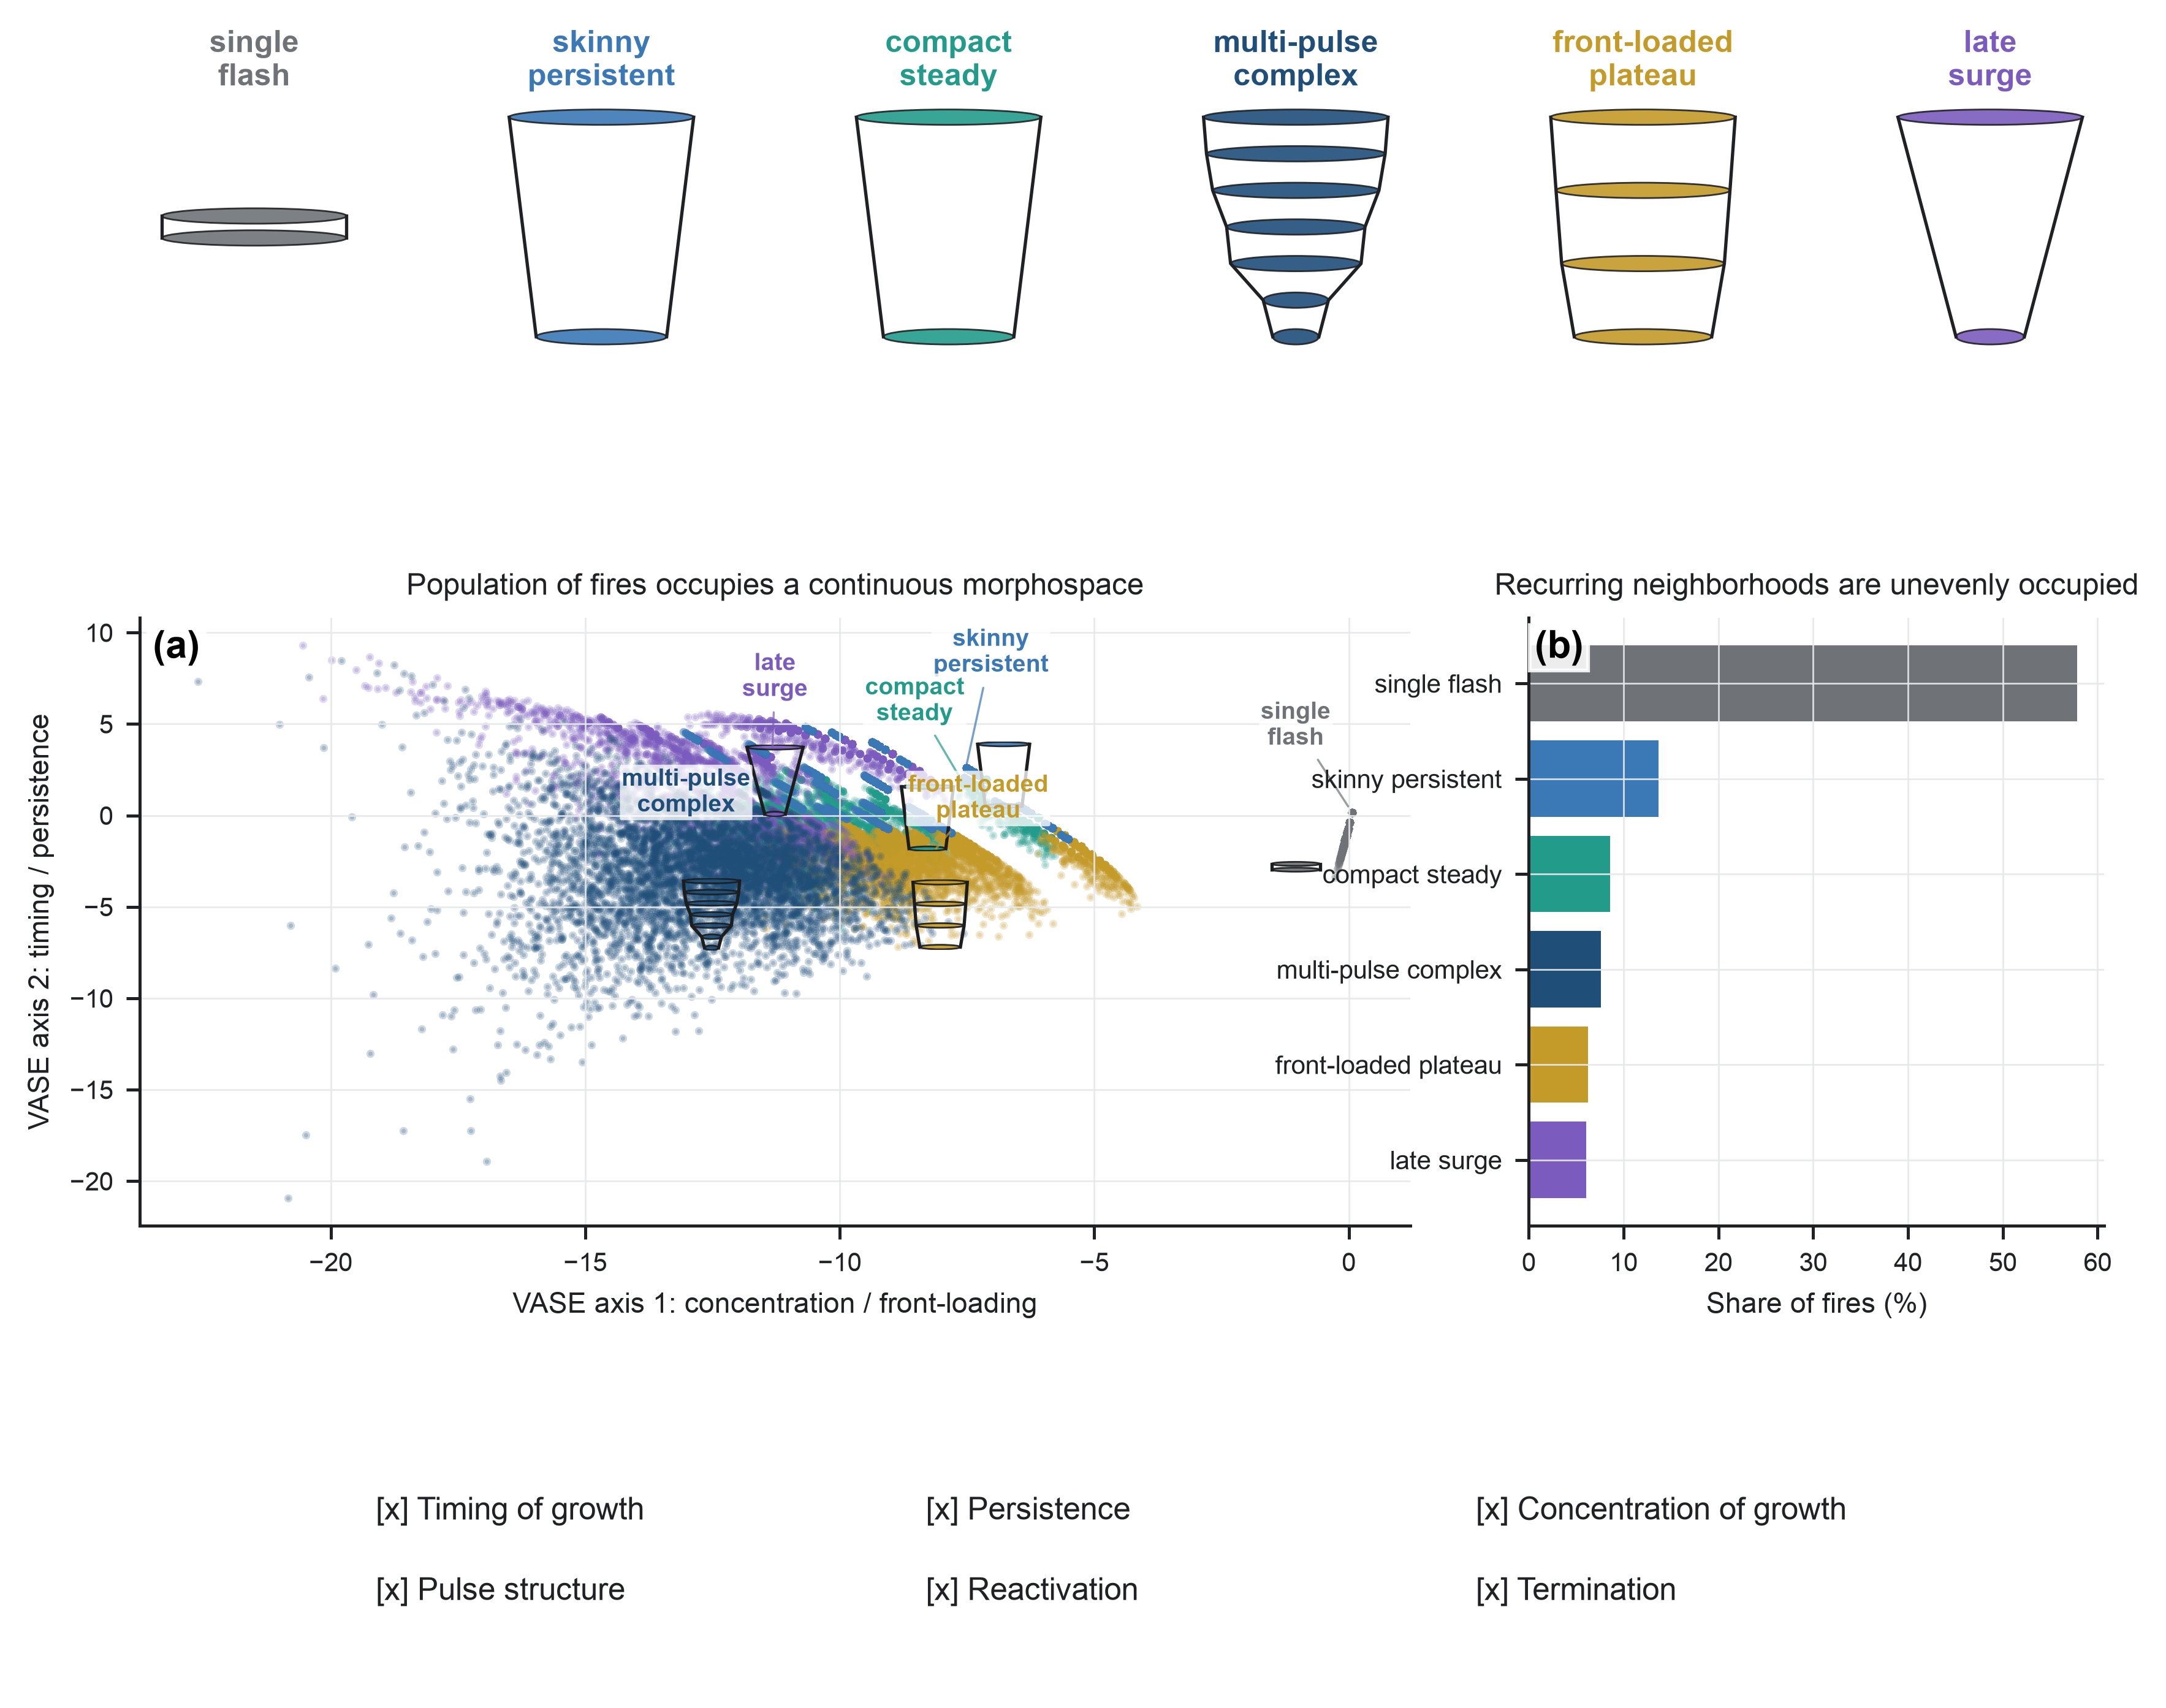
Figure 2. Wildfire histories vary along recurring developmental gradients. Observed fires occupy a continuous Fire VASE morphospace rather than isolated types.
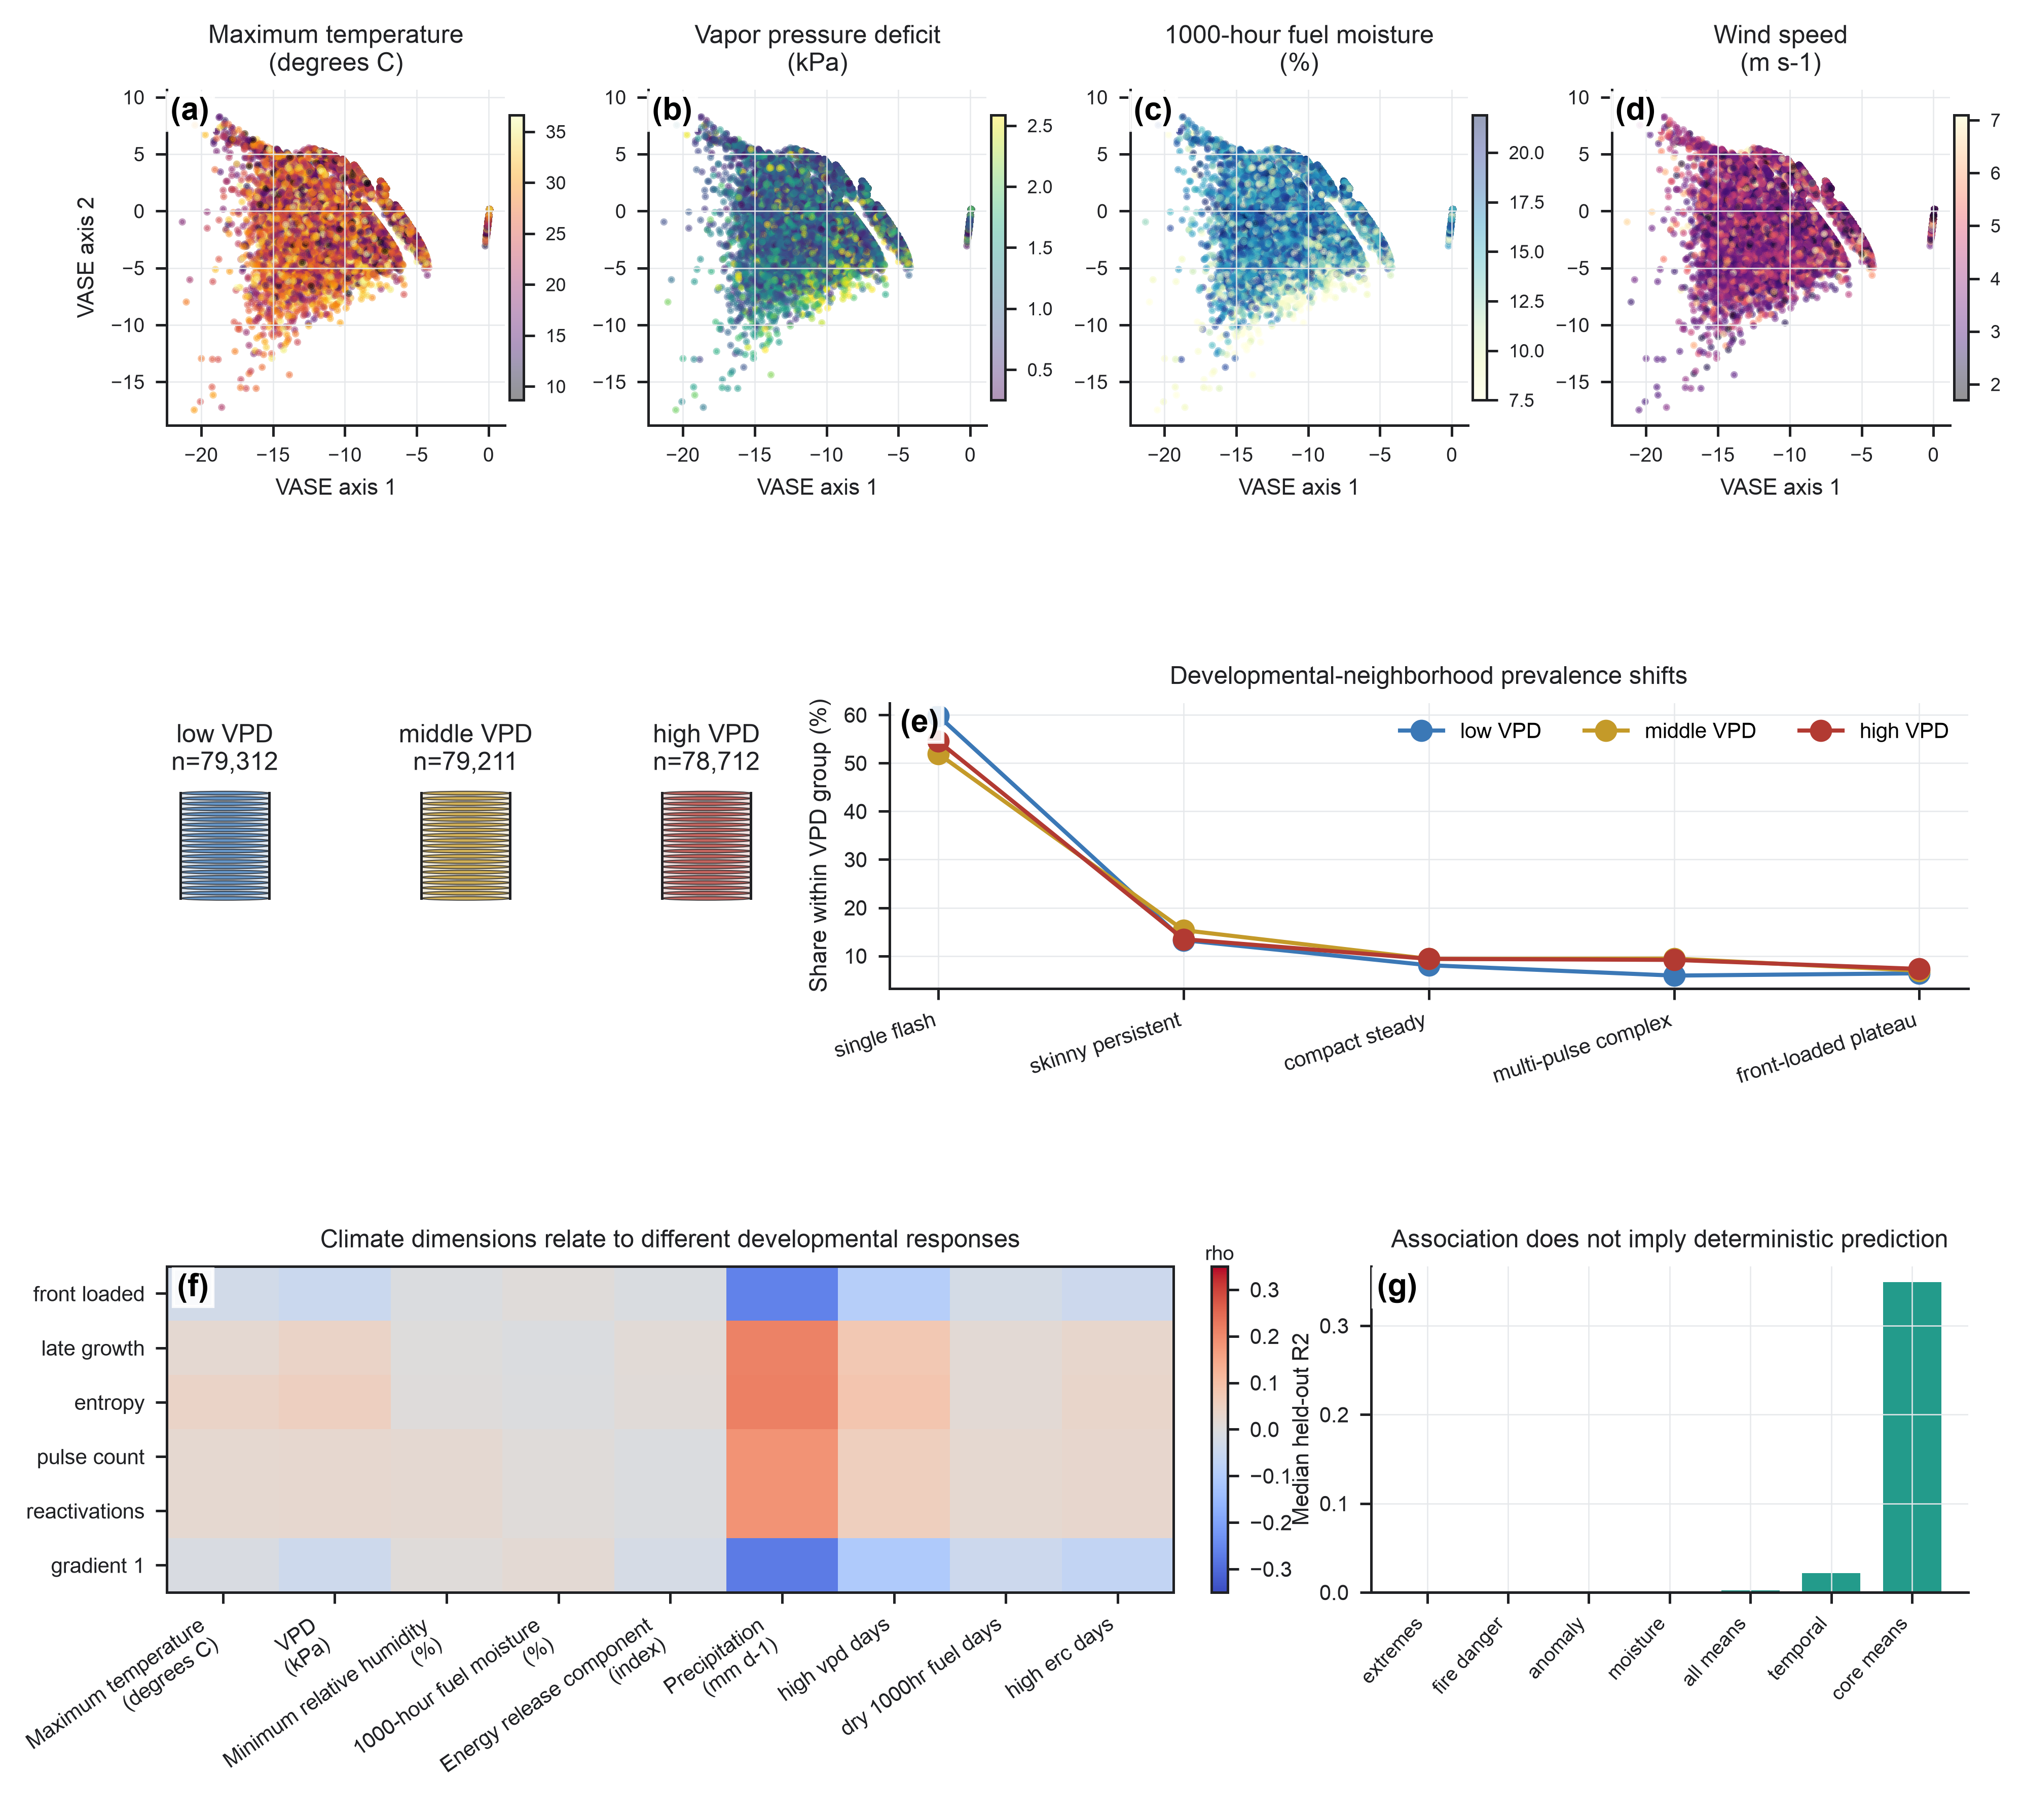
Figure 3. Climate shifts the probability of developmental forms. Climate variables are projected onto the geometry-first Fire VASE morphospace after the axes are estimated from fire histories alone.
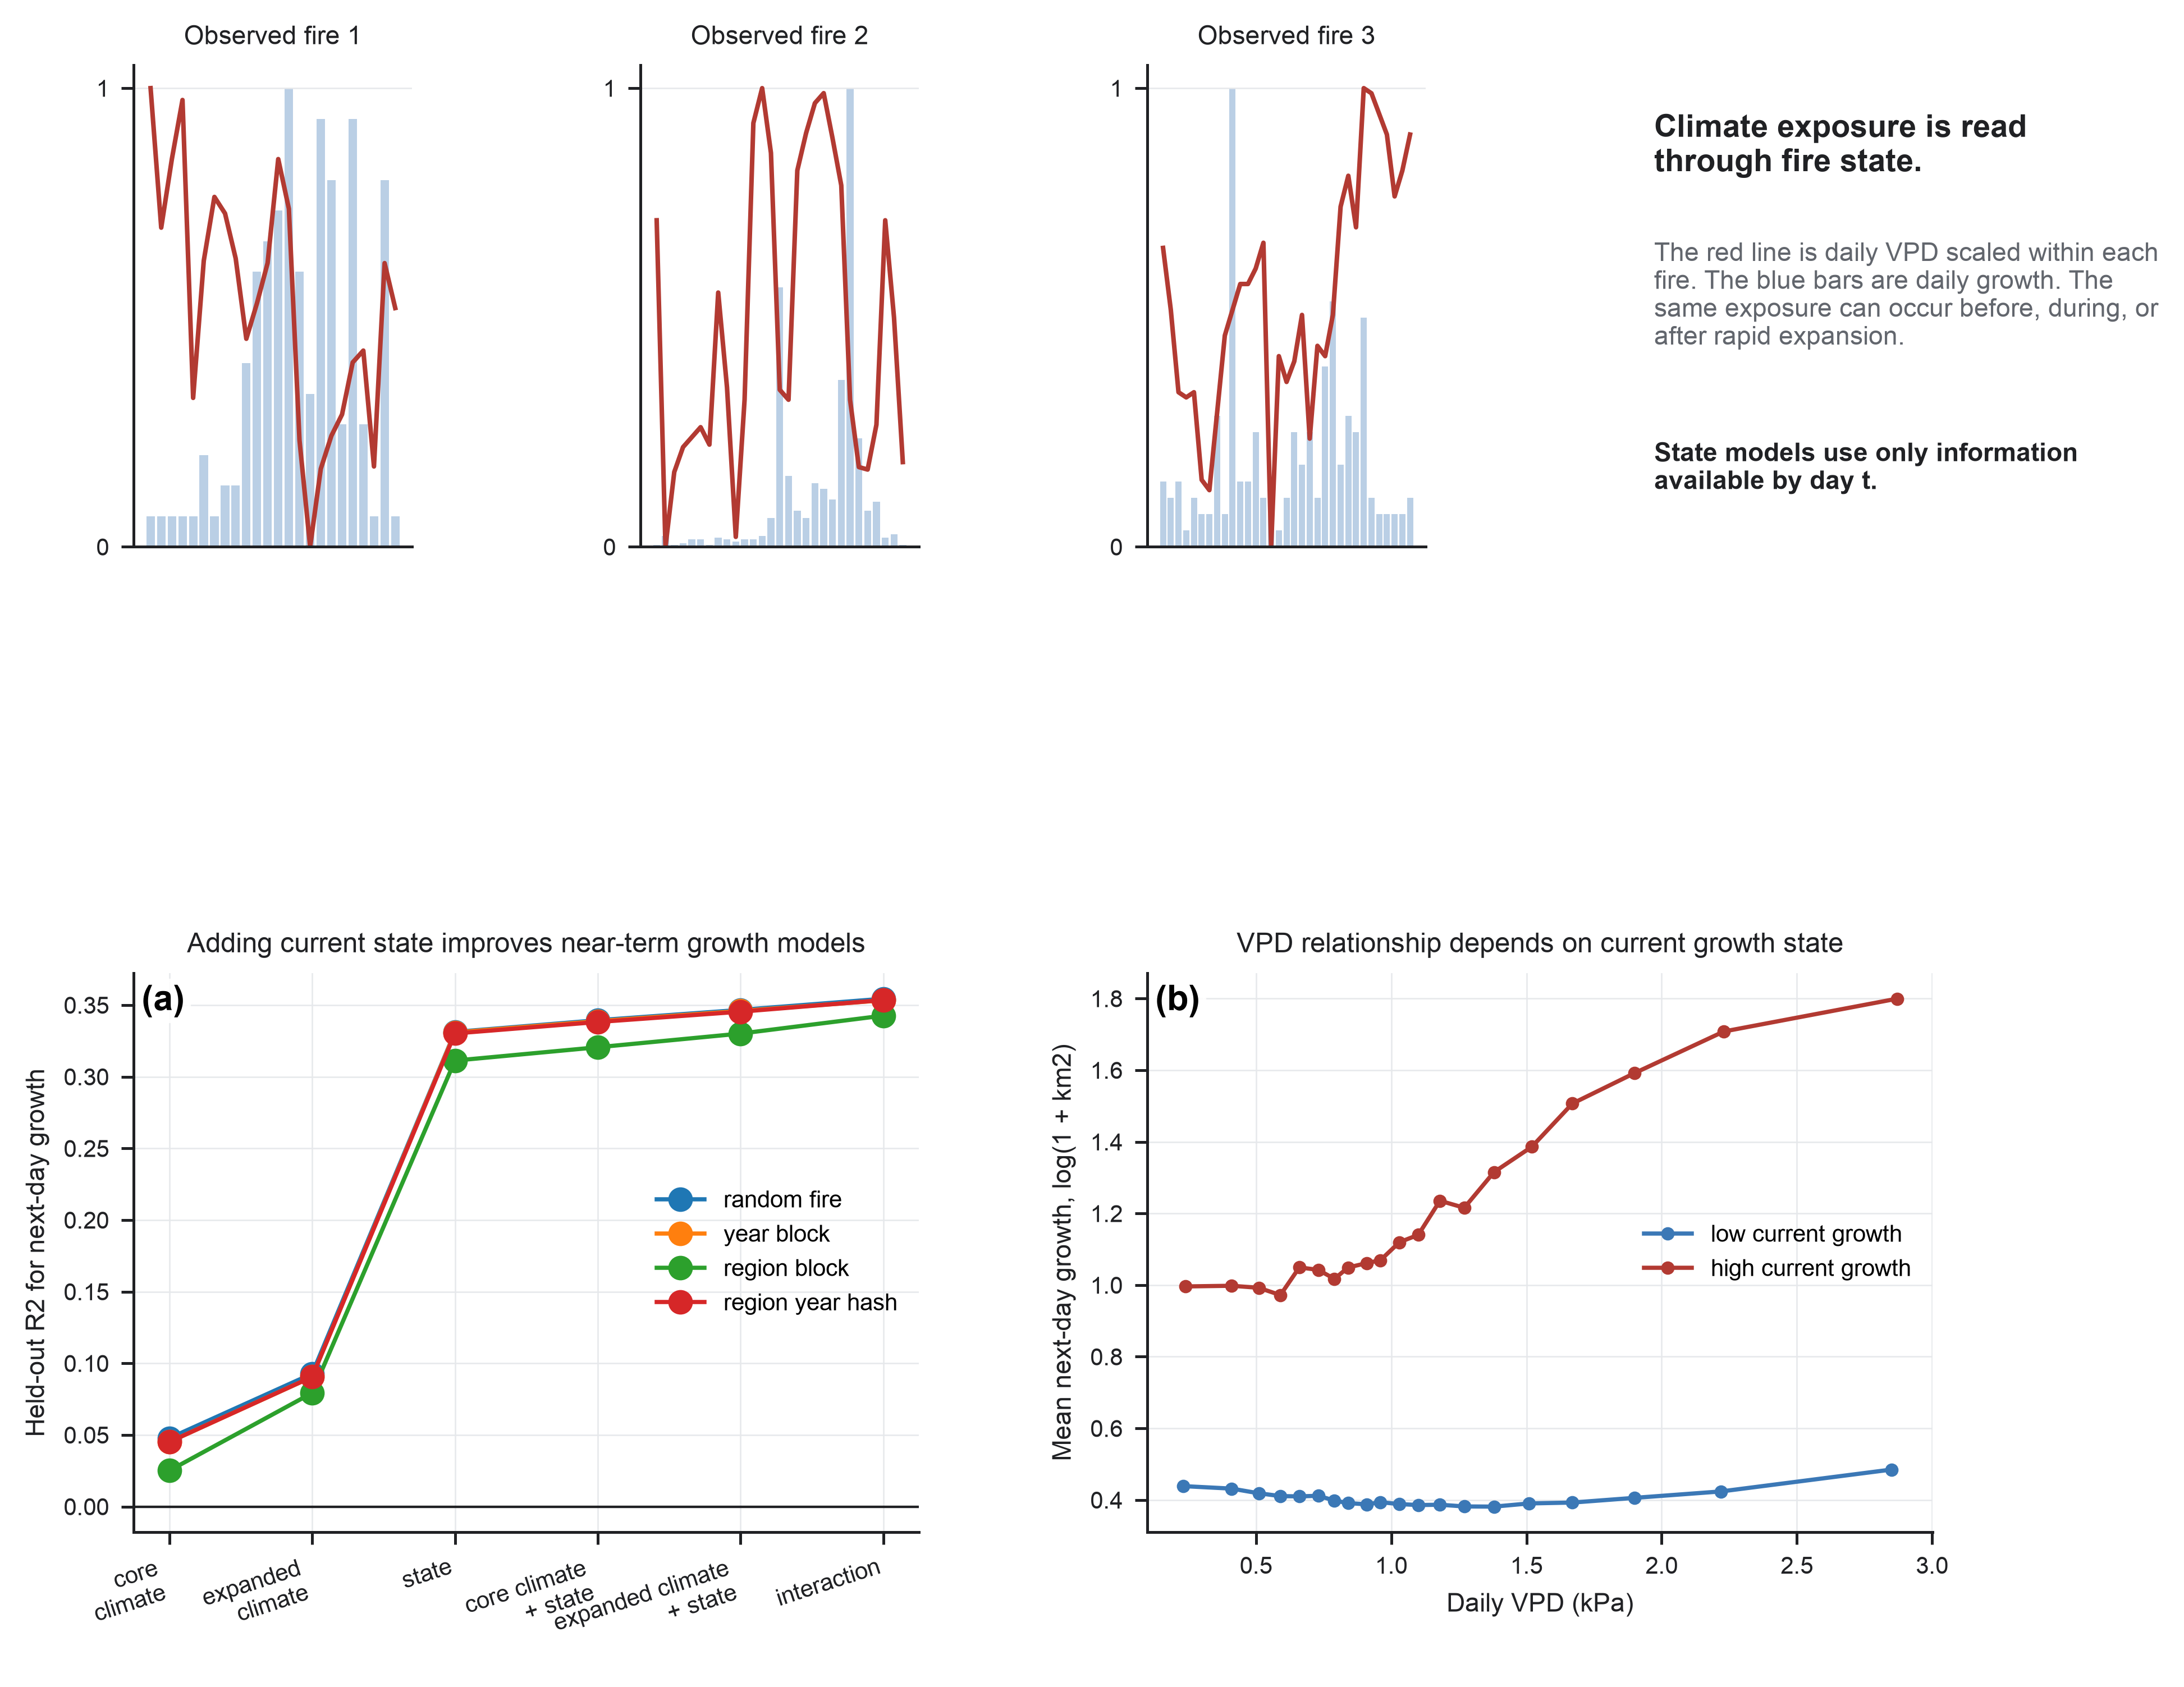
Figure 4. Developmental state changes how climate is expressed through growth. The historical model shifted adjacent observations without enforcing calendar spacing and used final-event centroids. V2 replaces this interpretation.
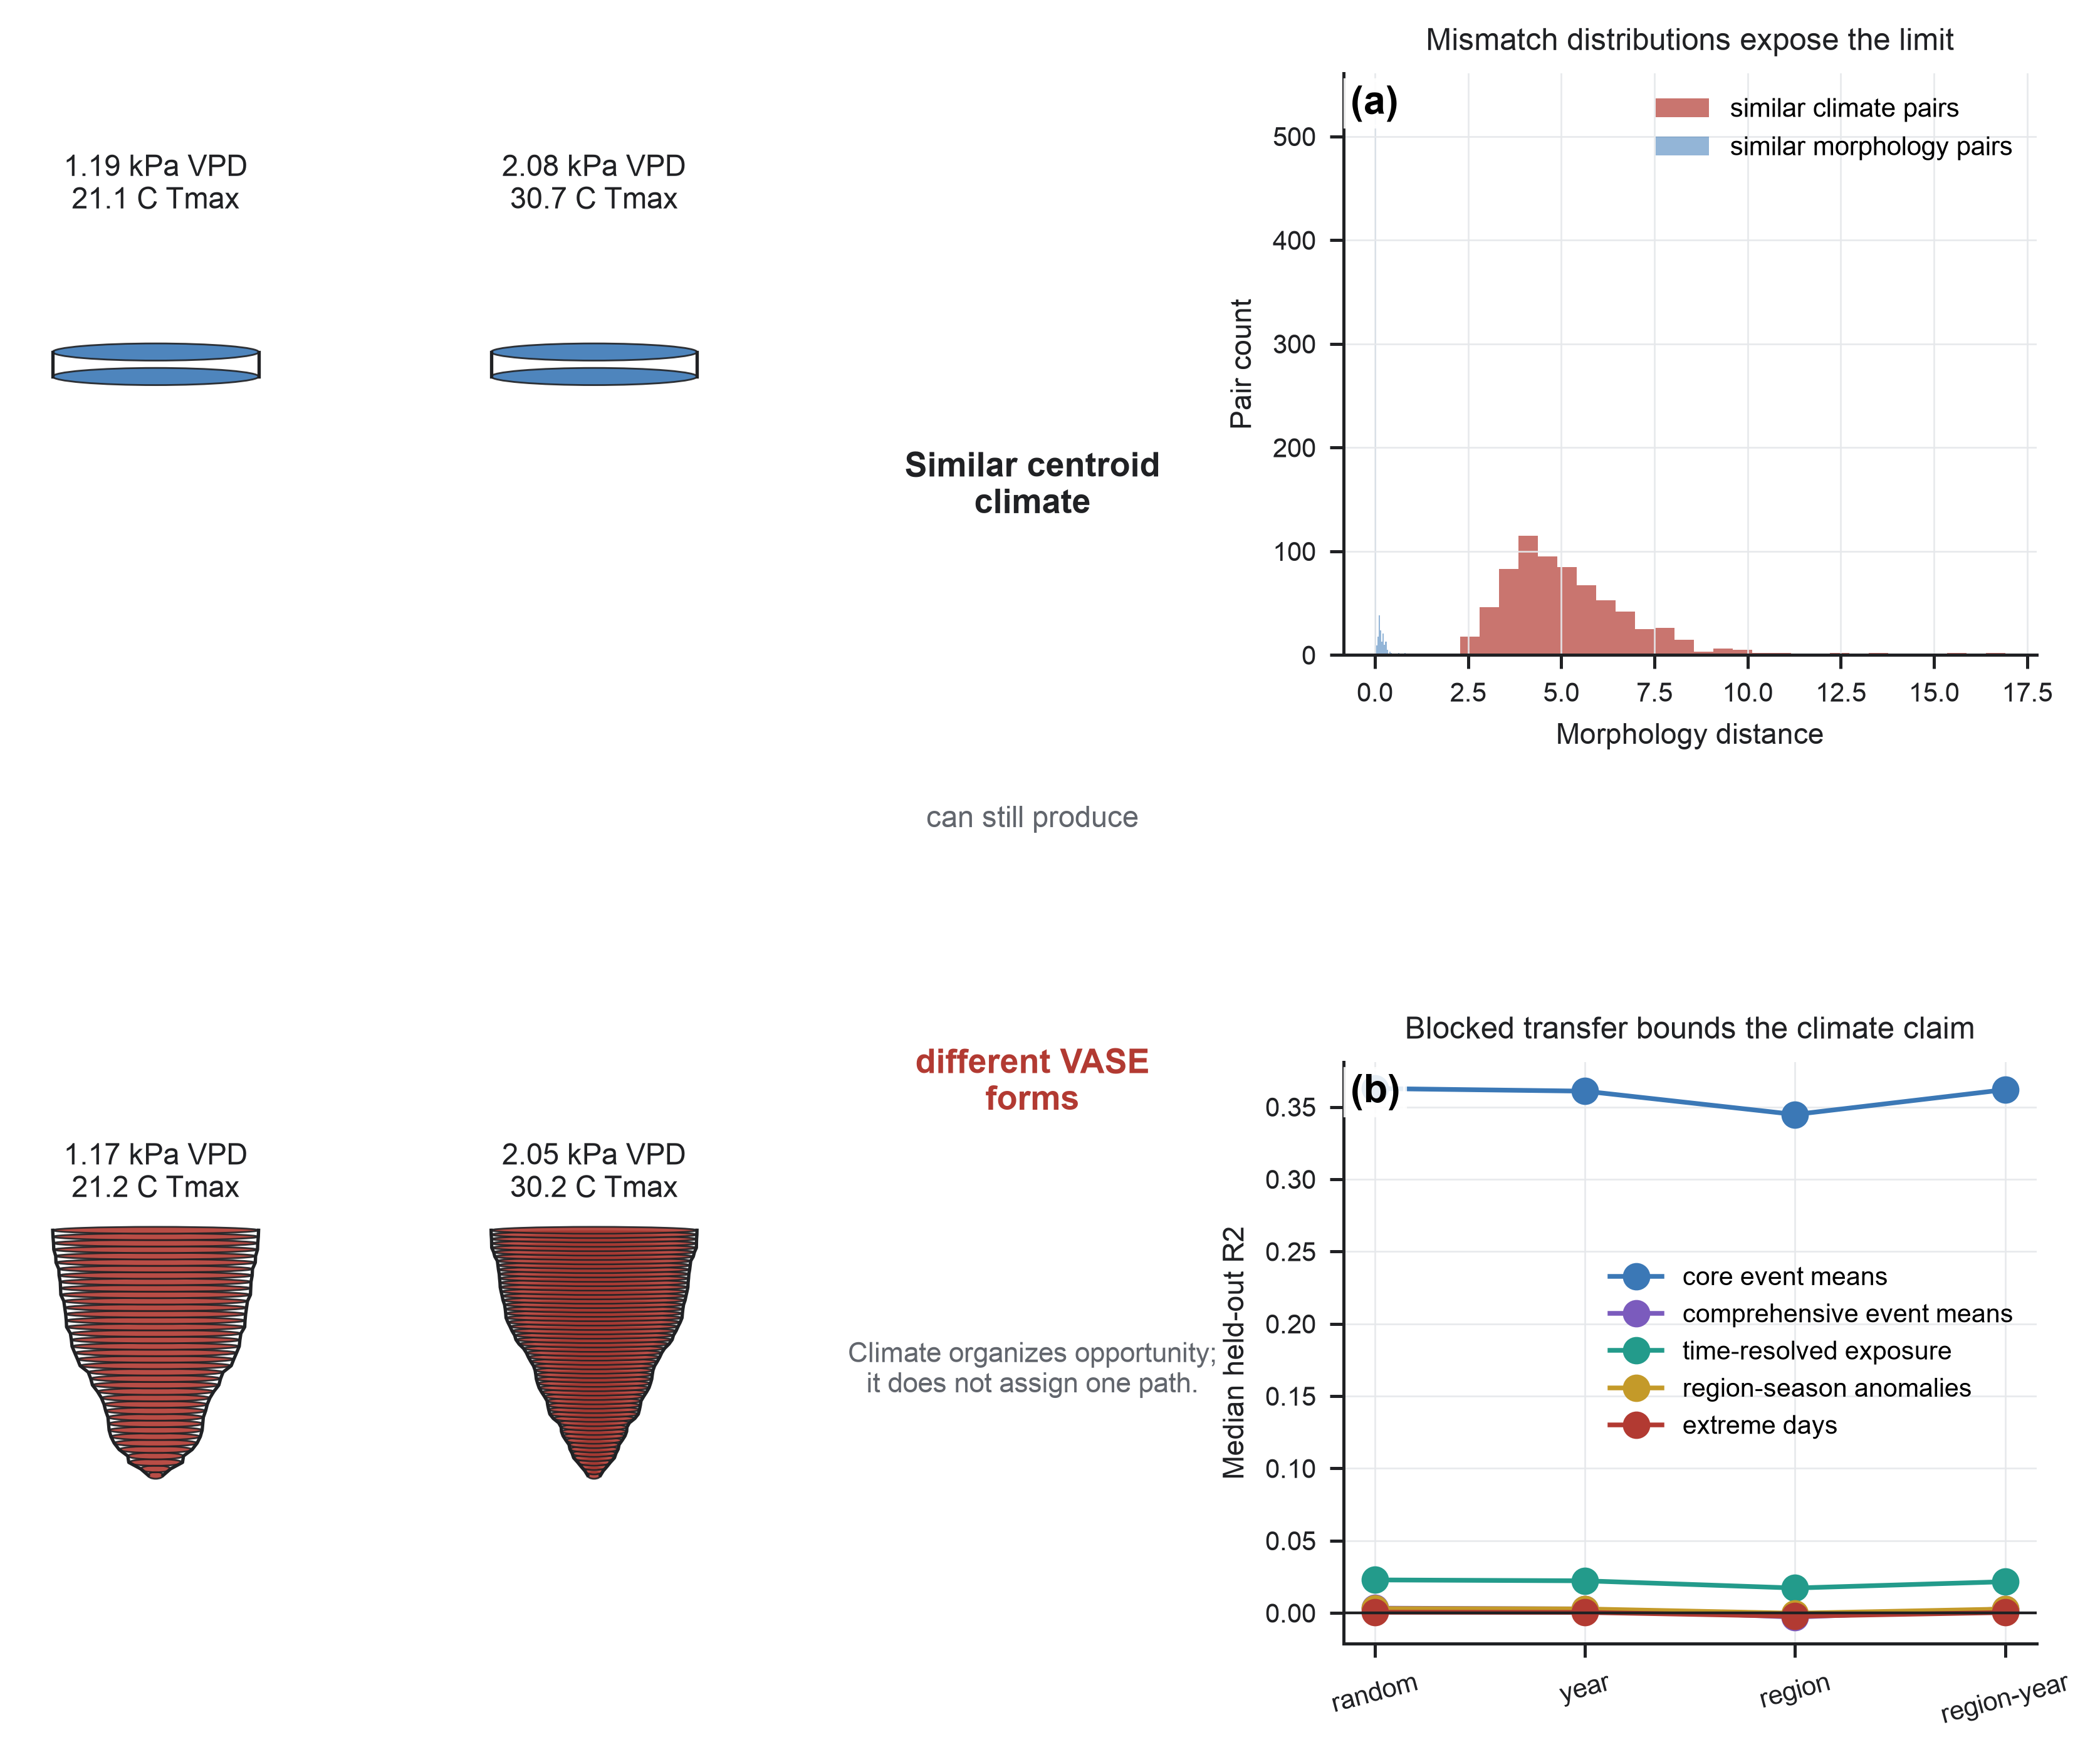
Figure 5. Climate organizes opportunity without uniquely determining outcome. Matched examples and blocked validation define the boundary of the current centroid-climate interpretation.
Historical supplementary figures
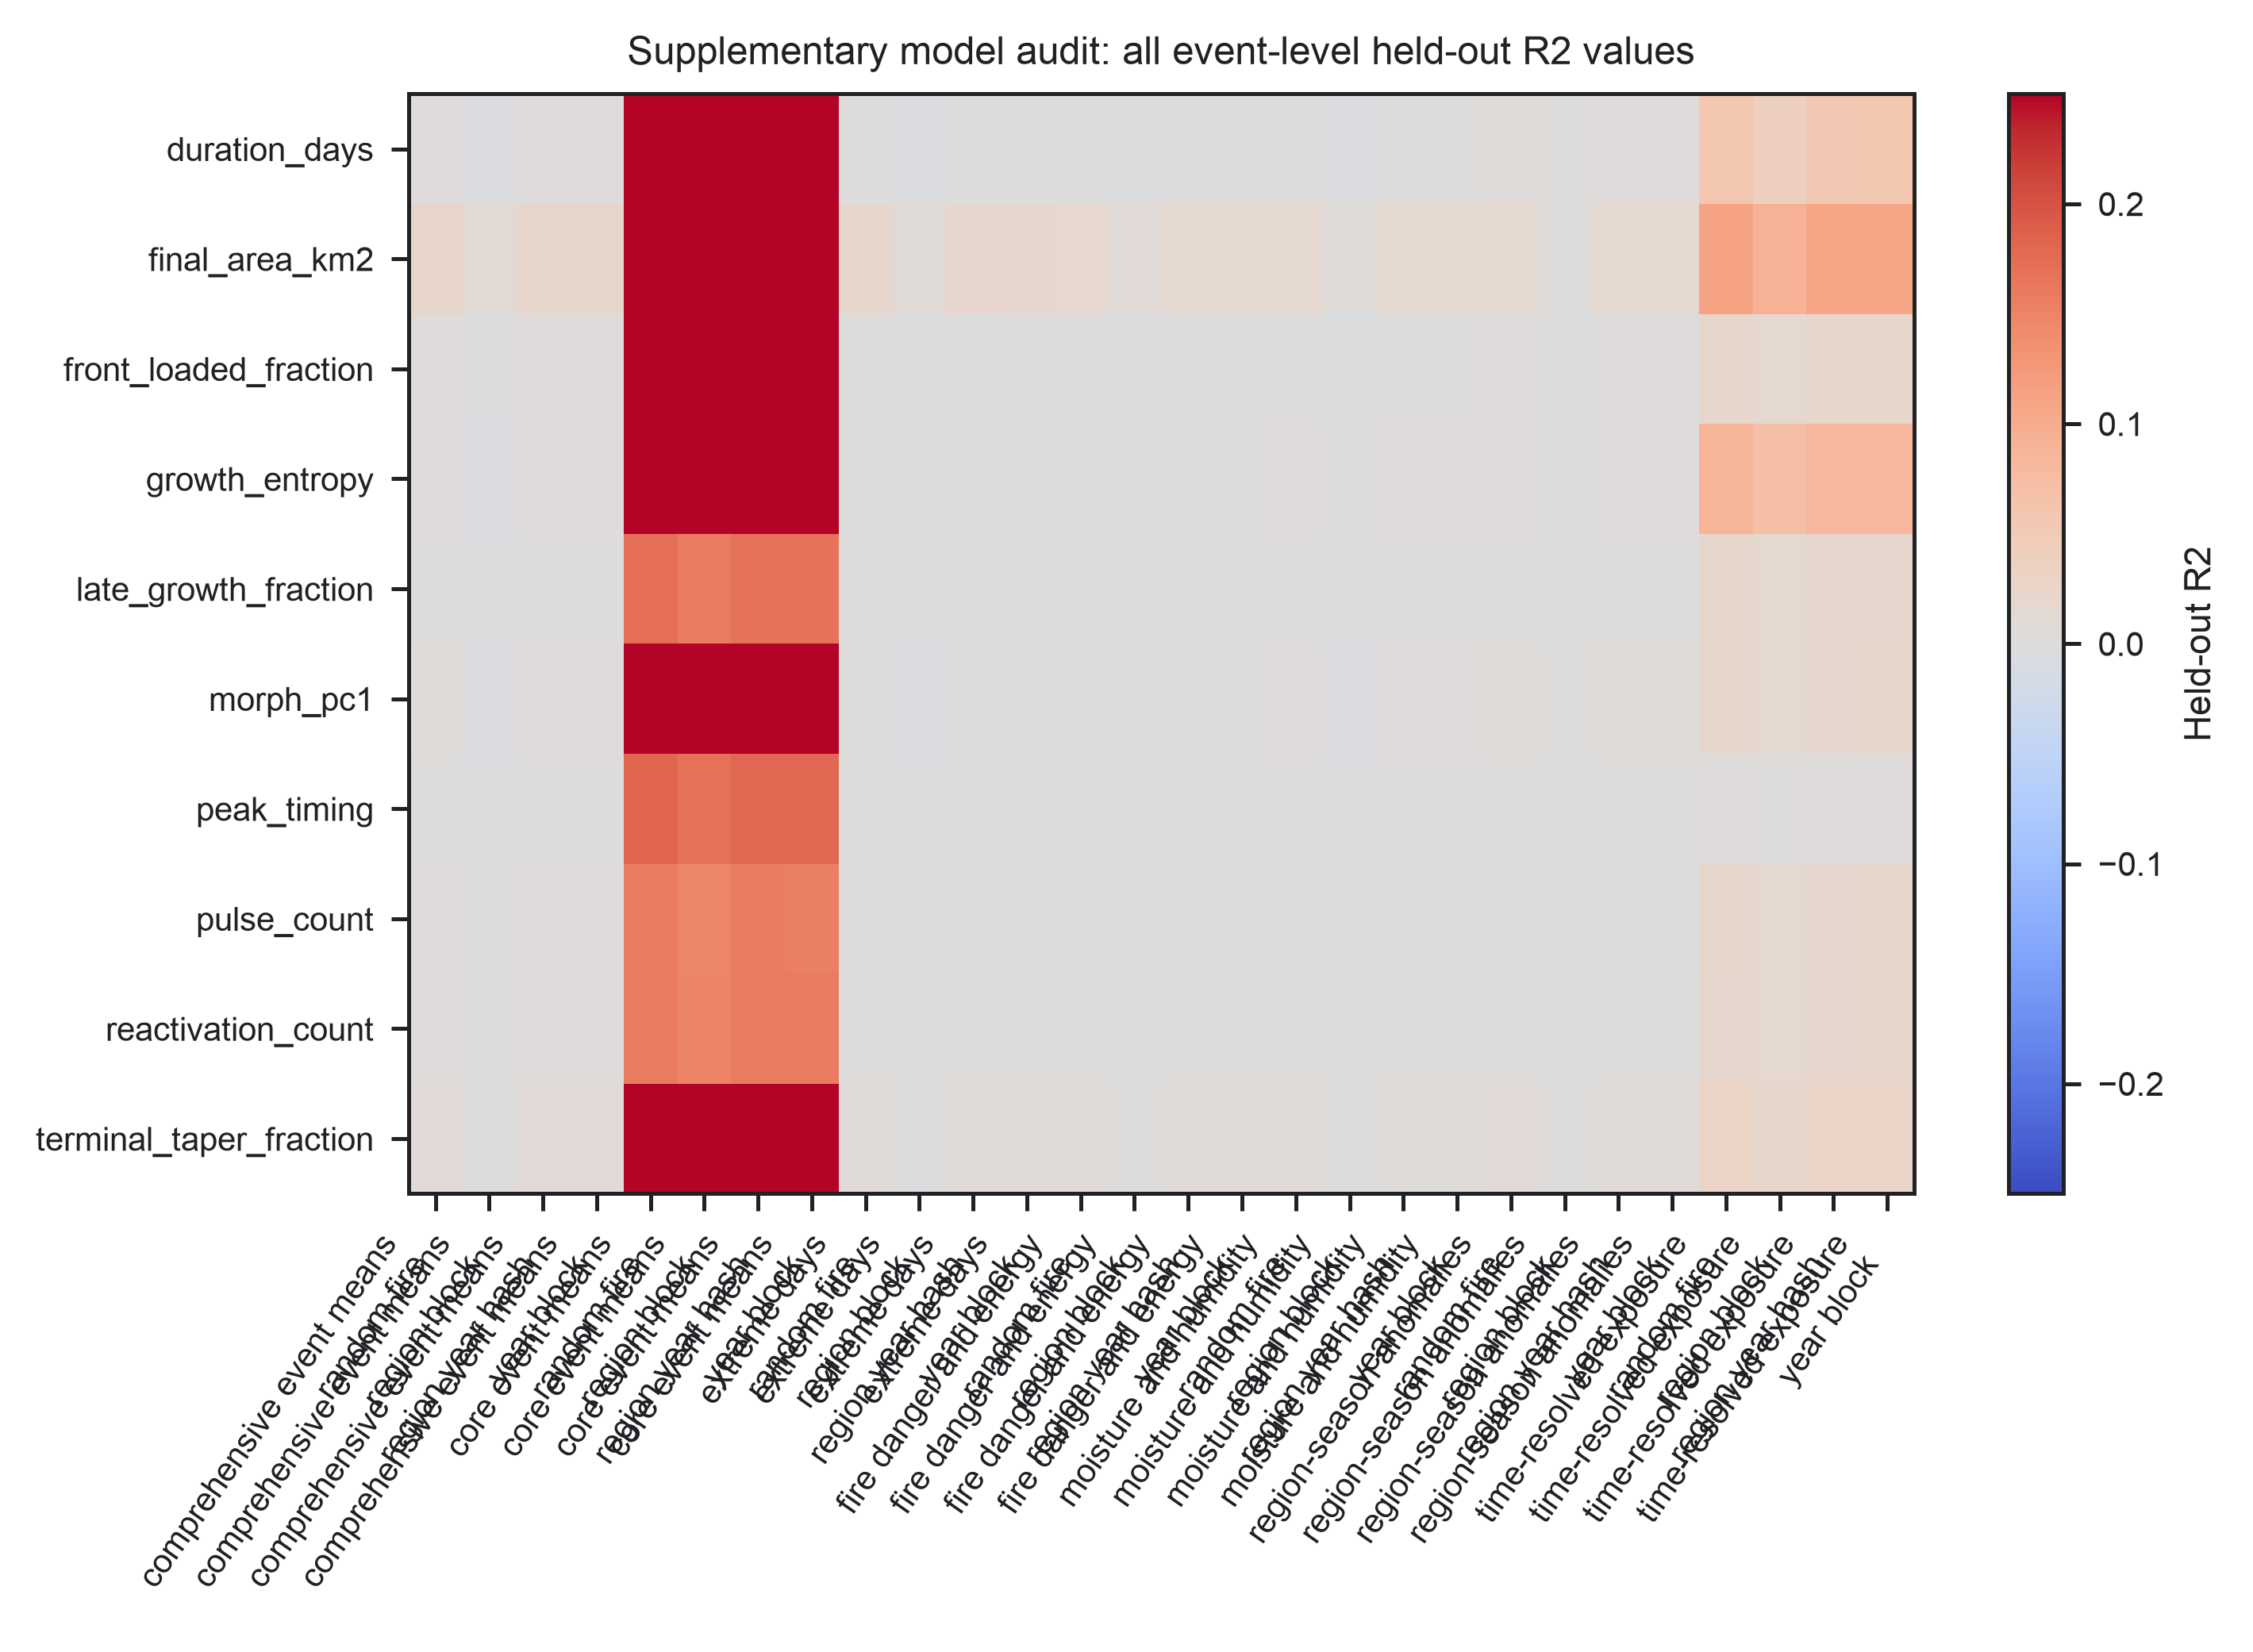
Supplementary Figure 1. Event-level model summaries.
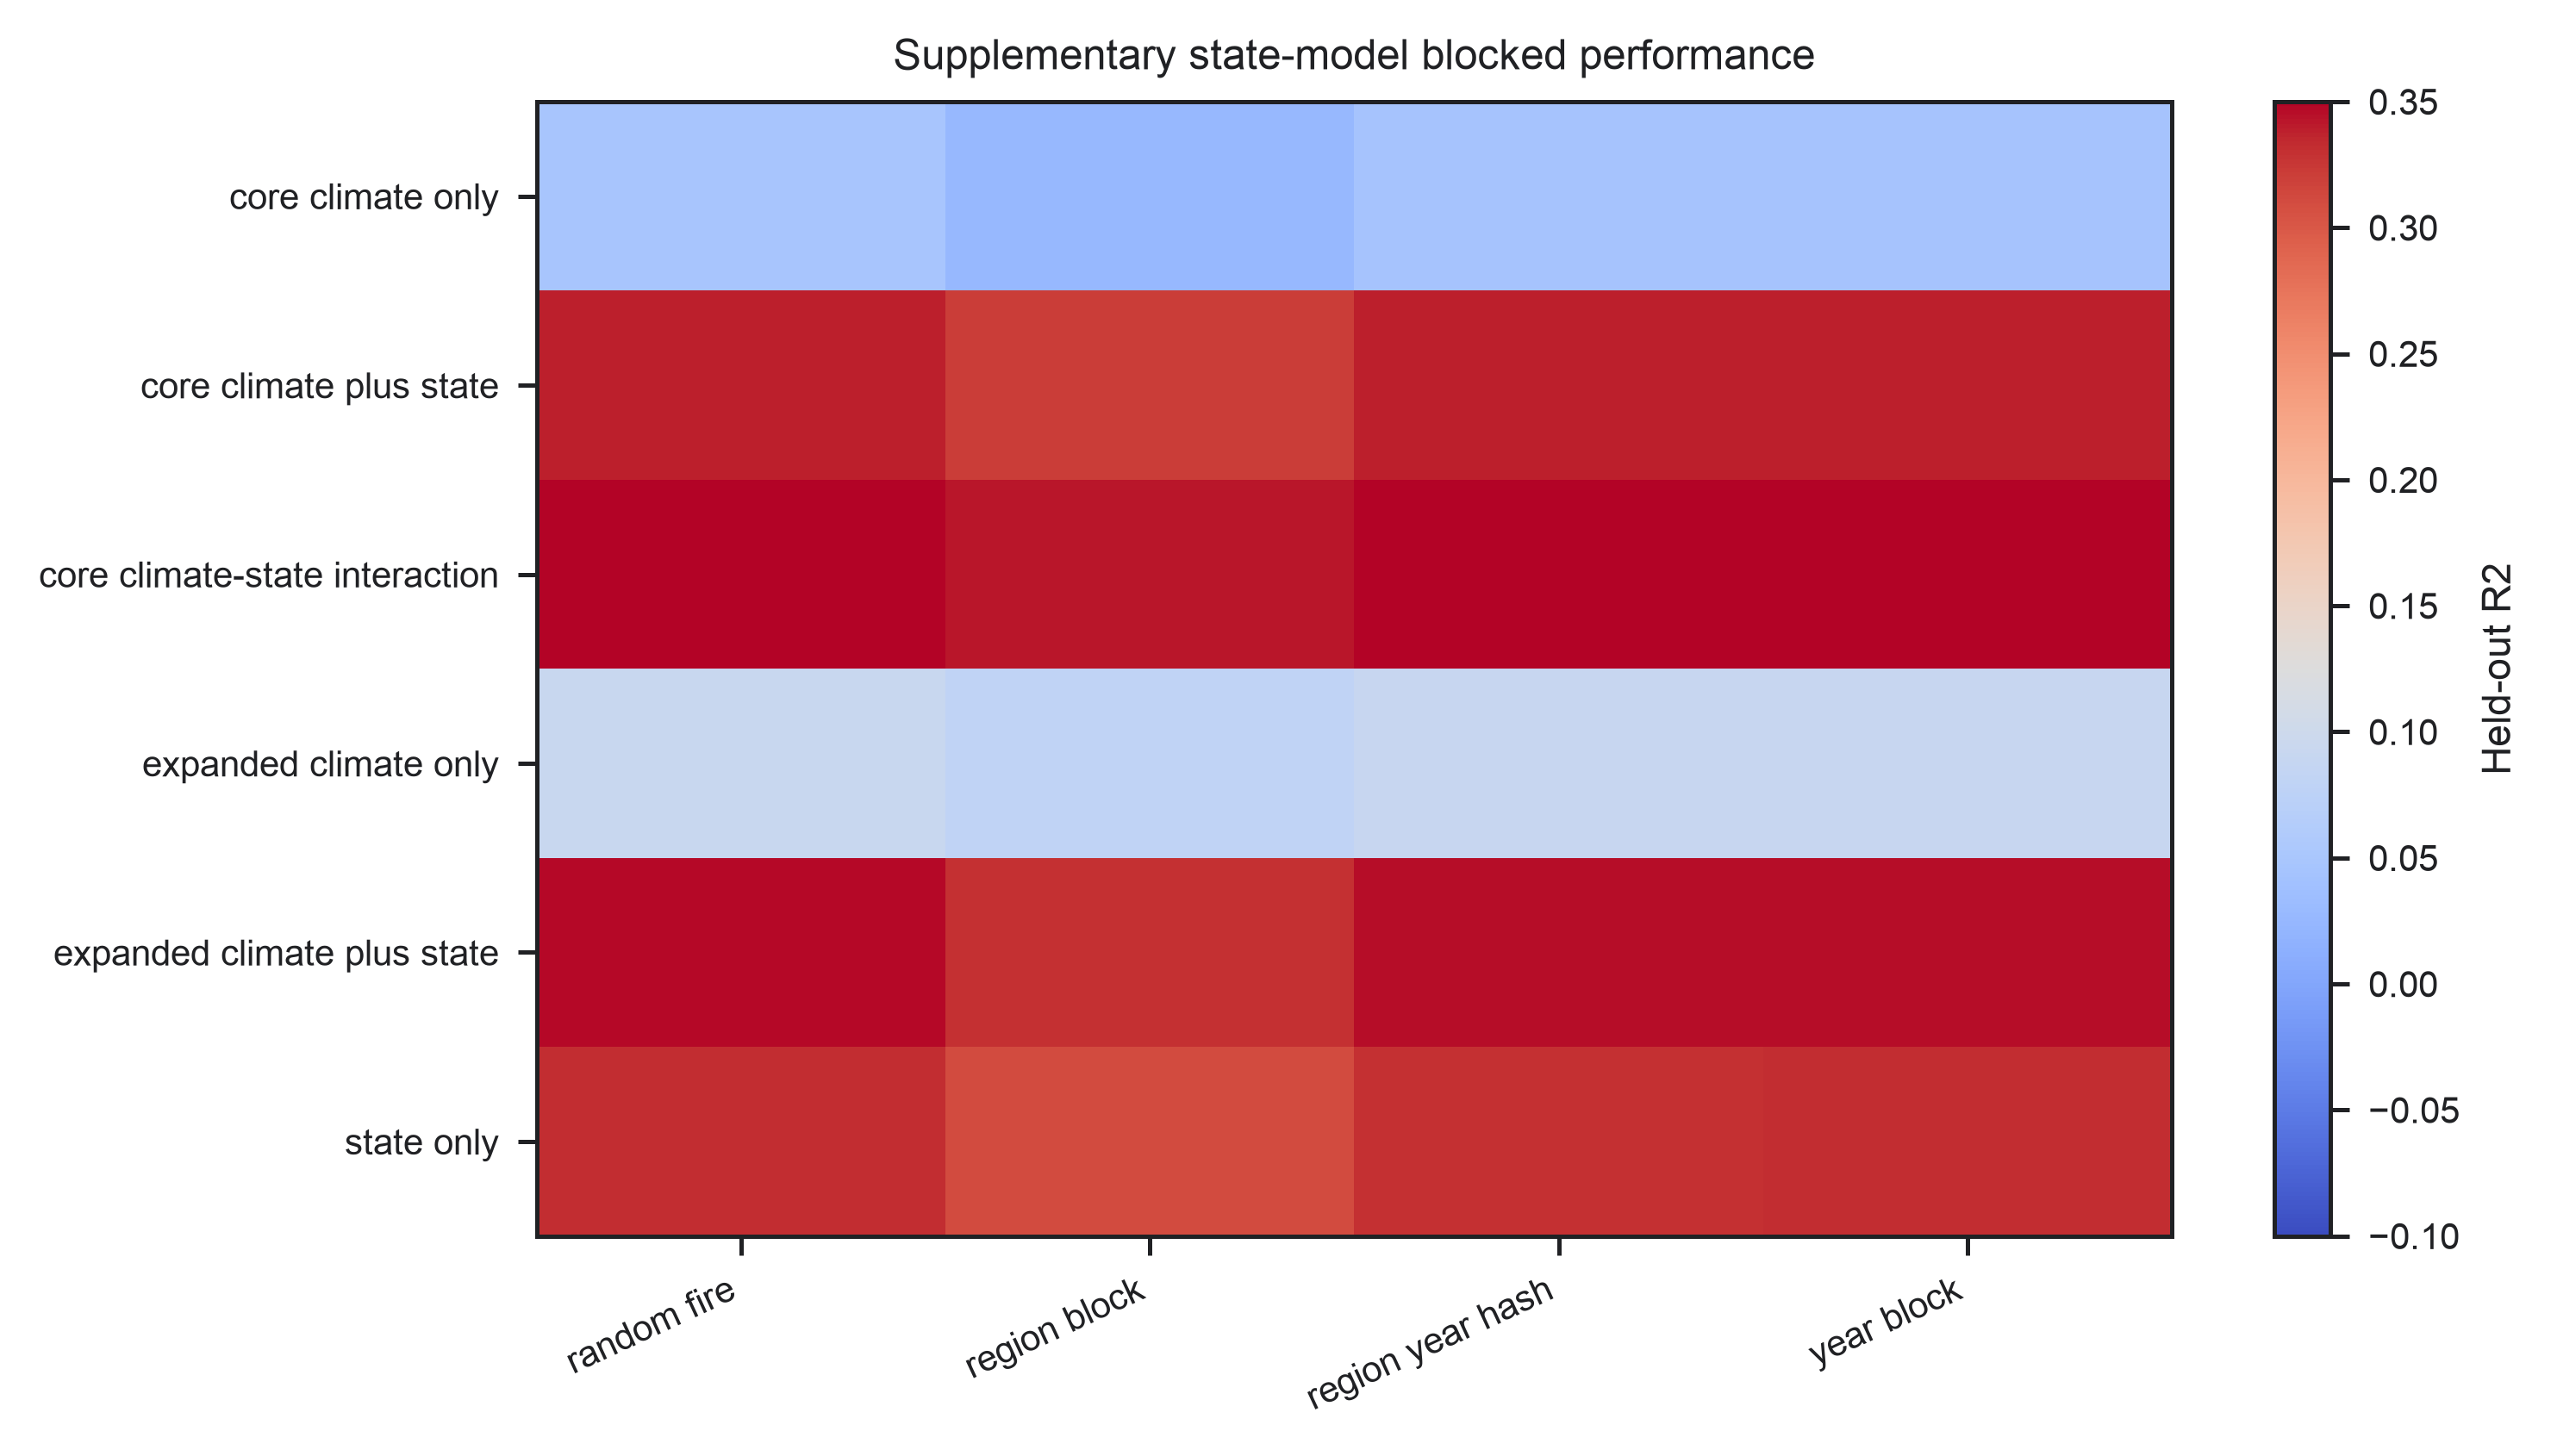
Supplementary Figure 2. State-dependent model summaries.
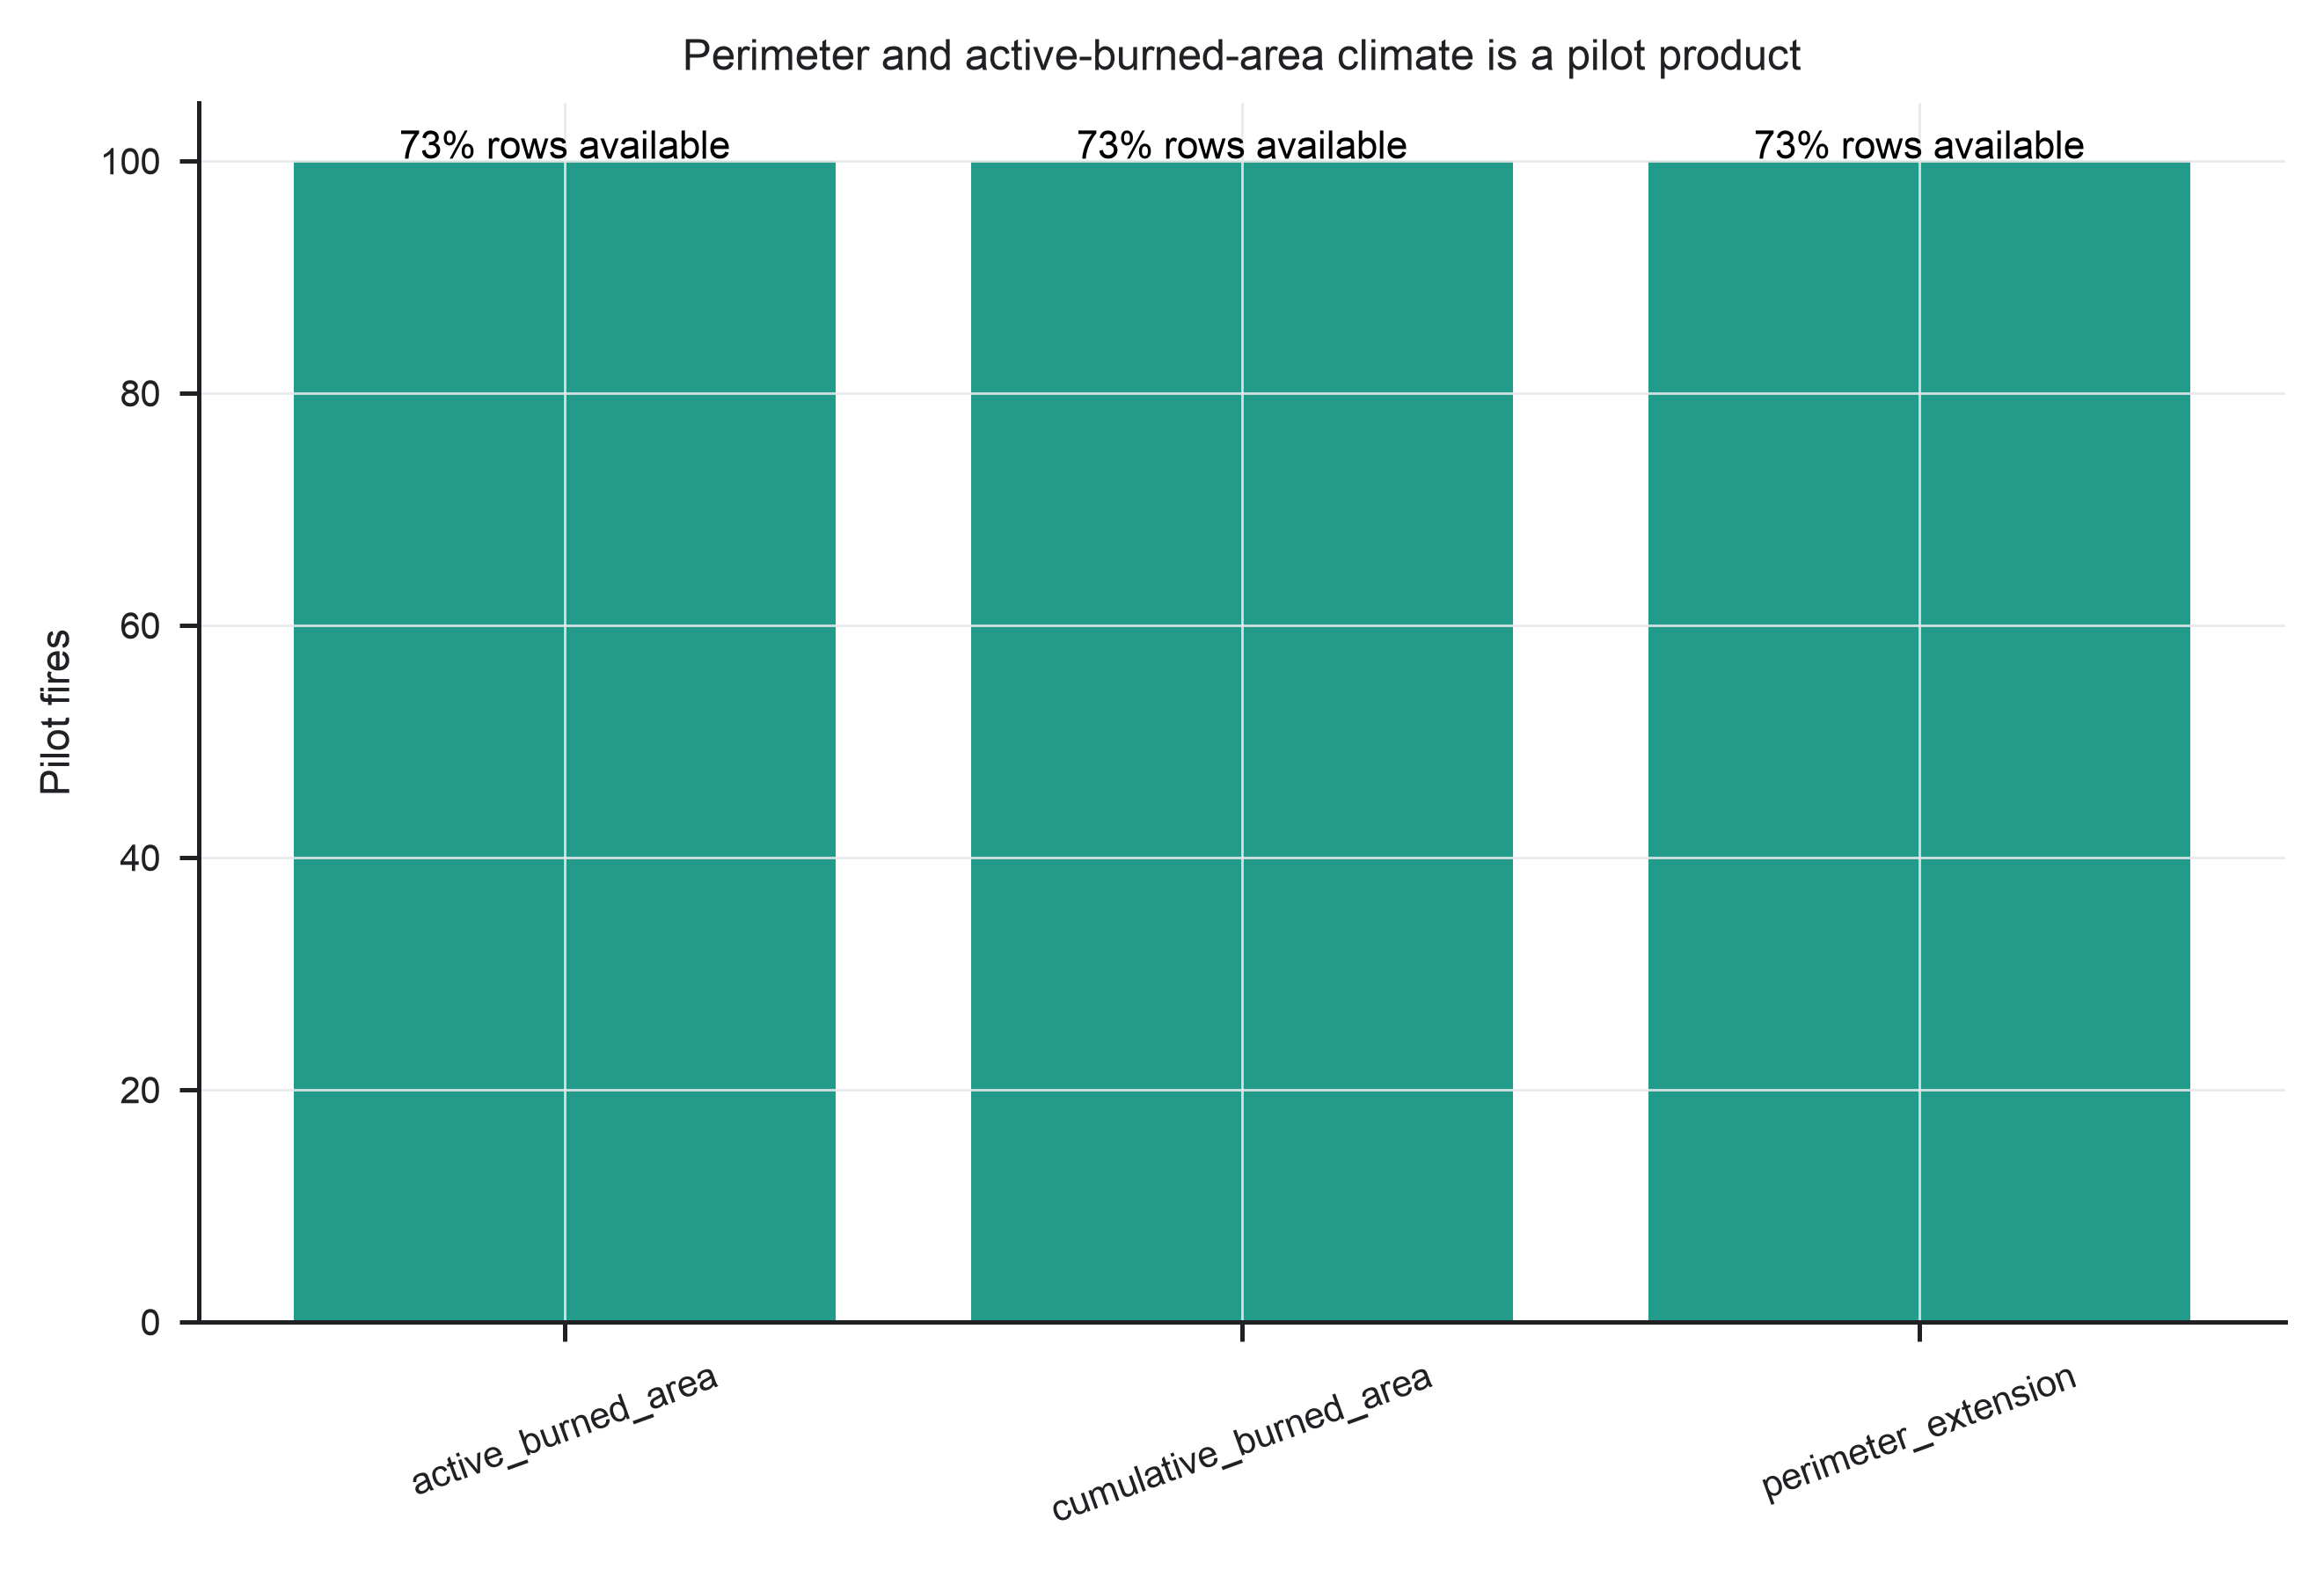
Supplementary Figure 3. Perimeter and active-area climate-exposure pilot.
Reproduce the figures
The default pipeline produces the corrected v2 figures under figures/v2/,
with statistics in analysis/v2/. The historical generation is available only
through the explicit --generation legacy option. Numbered entry points live in
manuscript_figures/
and write PDF, PNG, and SVG outputs.
Inputs
Use either a restored repository-style data root or the data-lake package:
data_lake/fire-vase-data-lake-v0.1
The figure scripts expect the lake to contain:
scratch/fire_vase_run_full/tables/scratch/fire_vase_developmental_morphology/repository/figures/main/derived_stats/repository/analysis/claim_audit_stats/
Run All Figures
uv run python manuscript_figures/00_run_all.py \
  --data-lake data_lake/fire-vase-data-lake-v0.1
Outputs are written as PDF, PNG, and SVG files in manuscript_figures/.
Run One Figure
uv run python manuscript_figures/03_figure_3.py \
  --data-lake data_lake/fire-vase-data-lake-v0.1
Figure Entry Points
- 00_run_all.py
- 01_figure_1.py
- 02_figure_2.py
- 03_figure_3.py
- 04_figure_4.py
- 05_figure_5.py
- 06_supplementary_figure_1.py
Shared plotting code lives in
scripts/figures/.
Recompute Validation Tables
By default, the scripts seed cached derived statistics from the data lake. To recompute those validation tables from the lakehouse inputs:
uv run python manuscript_figures/00_run_all.py \
  --data-lake data_lake/fire-vase-data-lake-v0.1 \
  --force-validation
Check Reproducibility
Compare generated figures and derived statistics against the checked-in reference artifacts:
uv run python scripts/check_reproducibility.py --skip-data-lake
Save a JSON report:
uv run python scripts/check_reproducibility.py \
  --skip-data-lake \
  --json-output analysis/reproducibility_check_latest.json
The checker reports byte-level file hashes and pixel-level PNG comparisons. Pixel identity is the stricter visual check for the manuscript figures.