How we tried to break Fire VASE
Validation is organized around threats to the scientific argument: incomplete observation, constrained geometry, uninformative order, incorrect attribution, implementation errors, and tests that pass too easily.
6 / 6 PASS real-data validation modules in the published suite manifest Generated 25 August 2026 for FIRED event 20657; full repository suite: 152 passed, 2 intentionally skipped.
The six-module result checks an inspectable real-data sample and documented contracts. Population-scale statistical validation, null models, sensitivity analyses, and full-table provenance provide separate layers of evidence. A passing module is not treated as proof of ecological validity.
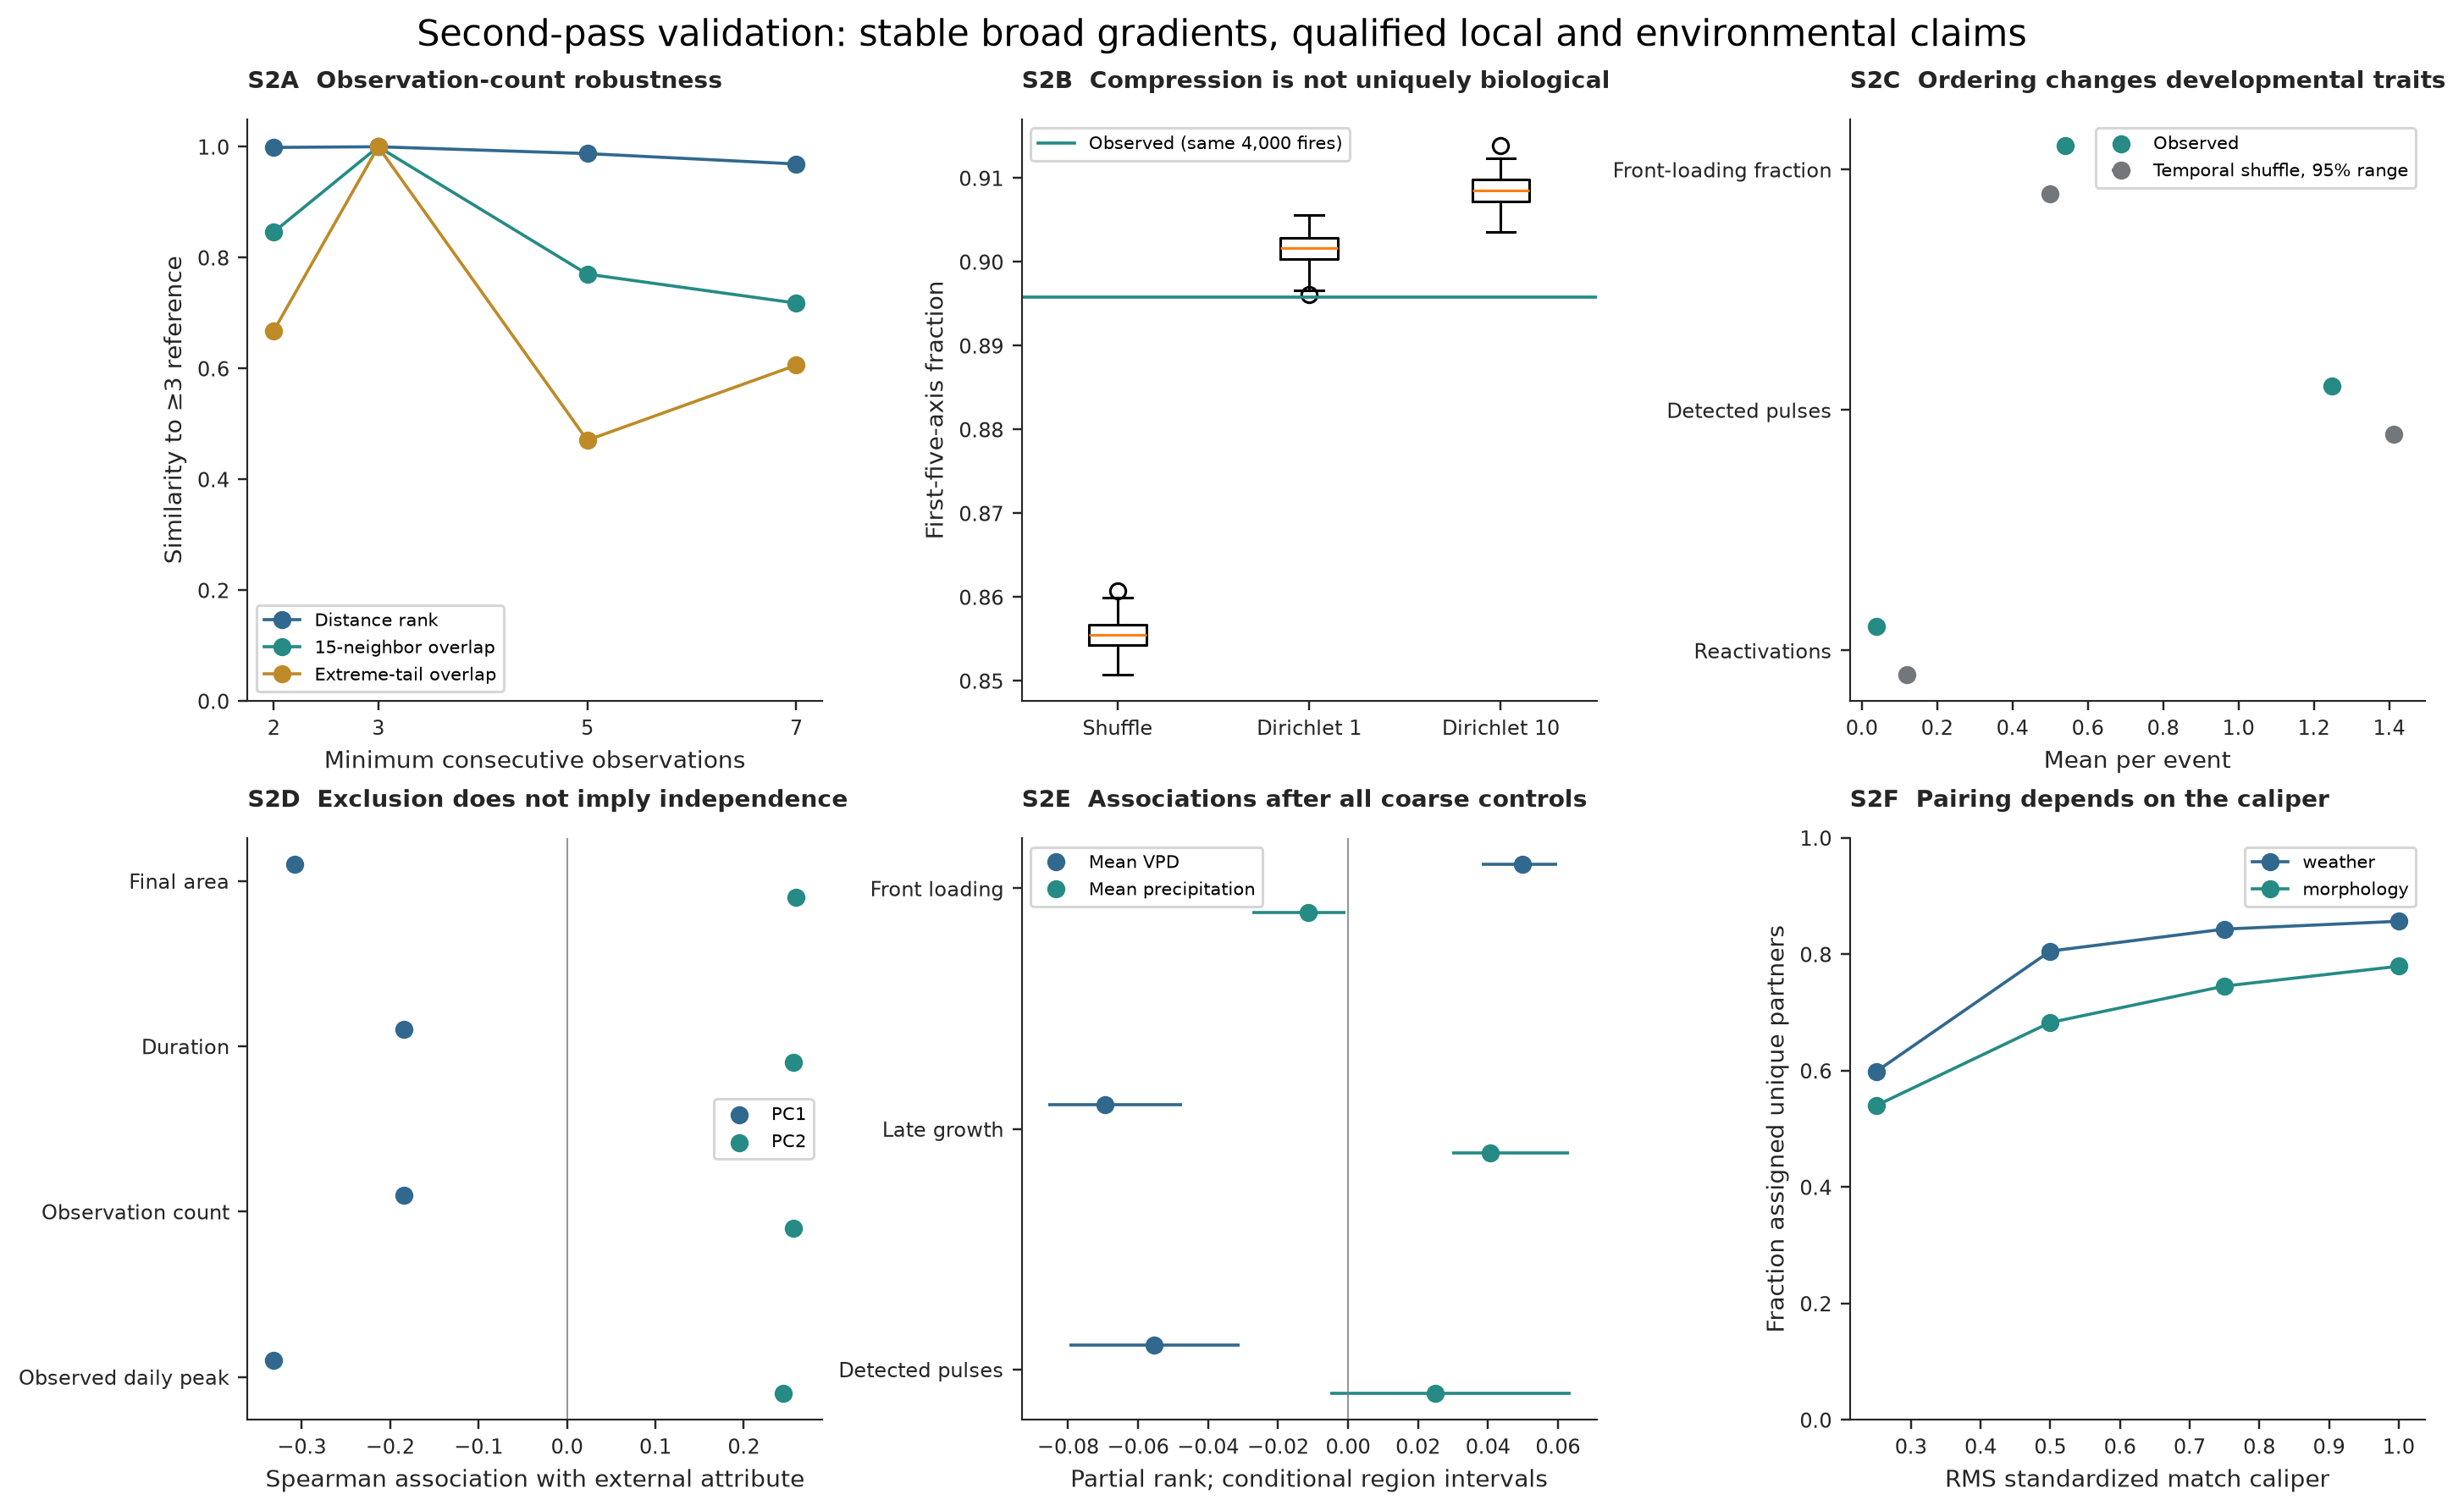
The central challenge figure. Read S2A–F as six attempts to weaken or narrow the argument, not as six confirmations of one claim. Some results hold strongly; others impose explicit limits on transfer, compression, weather attribution, or matching coverage. Technical caption
How to read the validation figure
Does the result depend on observation depth?
Threat. Short histories may impose structure that would disappear when more daily observations are required.
Challenge. Refit the shape space at stricter consecutive-observation thresholds and evaluate each fit on the same 1,000 primary-event anchors.
Distance ranks, neighborhood overlap, and axis coverage collapse together as longer histories are required.
Broad ranks remain stable, but local neighborhoods and compact five-axis coverage weaken.
Result. At ≥7 observations, 1,171 fires remain. Pairwise-distance ranks correlate 0.969 with the primary fit, but 15-neighbor overlap is 71.8% and five-axis coverage falls to 74.2%. Broad gradients persist better than local neighborhoods, dimensionality, and extreme examples.
Inspect observation-depth evidence
Could the geometry be an artifact?
Threat. Normalized positive curves, PCA choices, polygon simplification, or hull construction might manufacture an apparently restricted space.
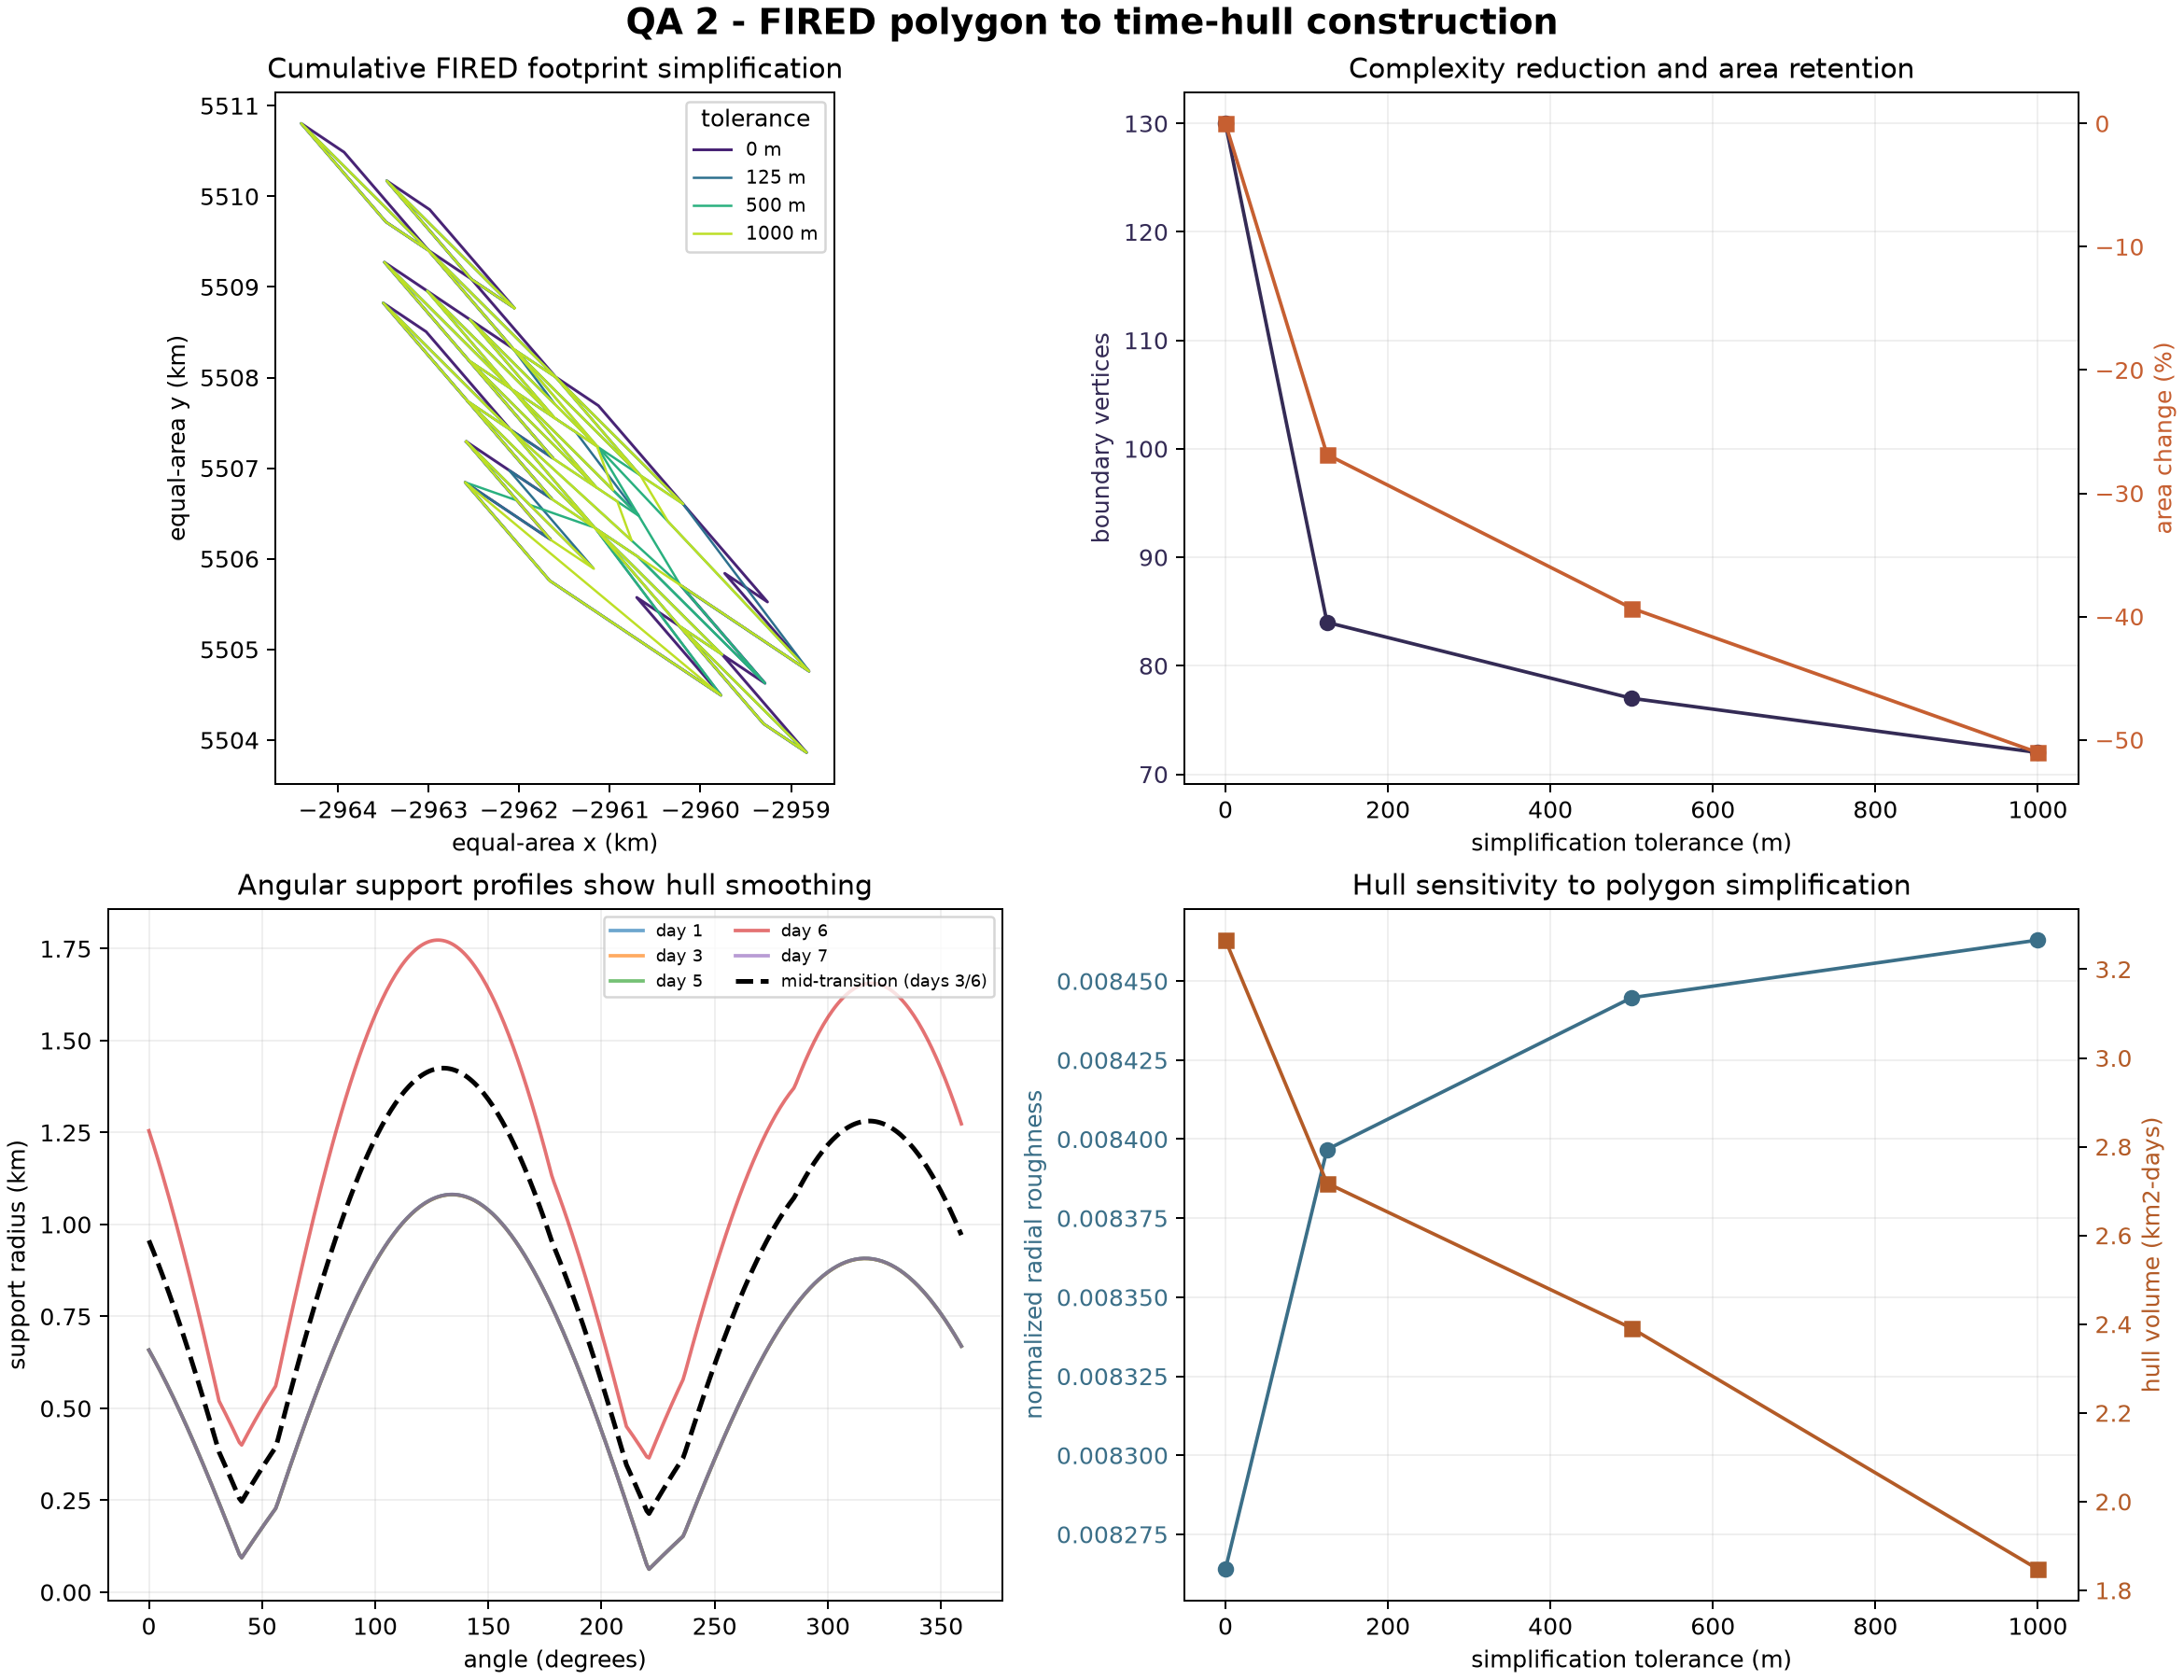
Challenge. Compare standardized-Euclidean and Hellinger geometry; use mass-conserving Dirichlet nulls; vary temporal support and resolution; audit FIRED simplification; expose daily, 3-day, 7-day, and cumulative 3-D hull alternatives.
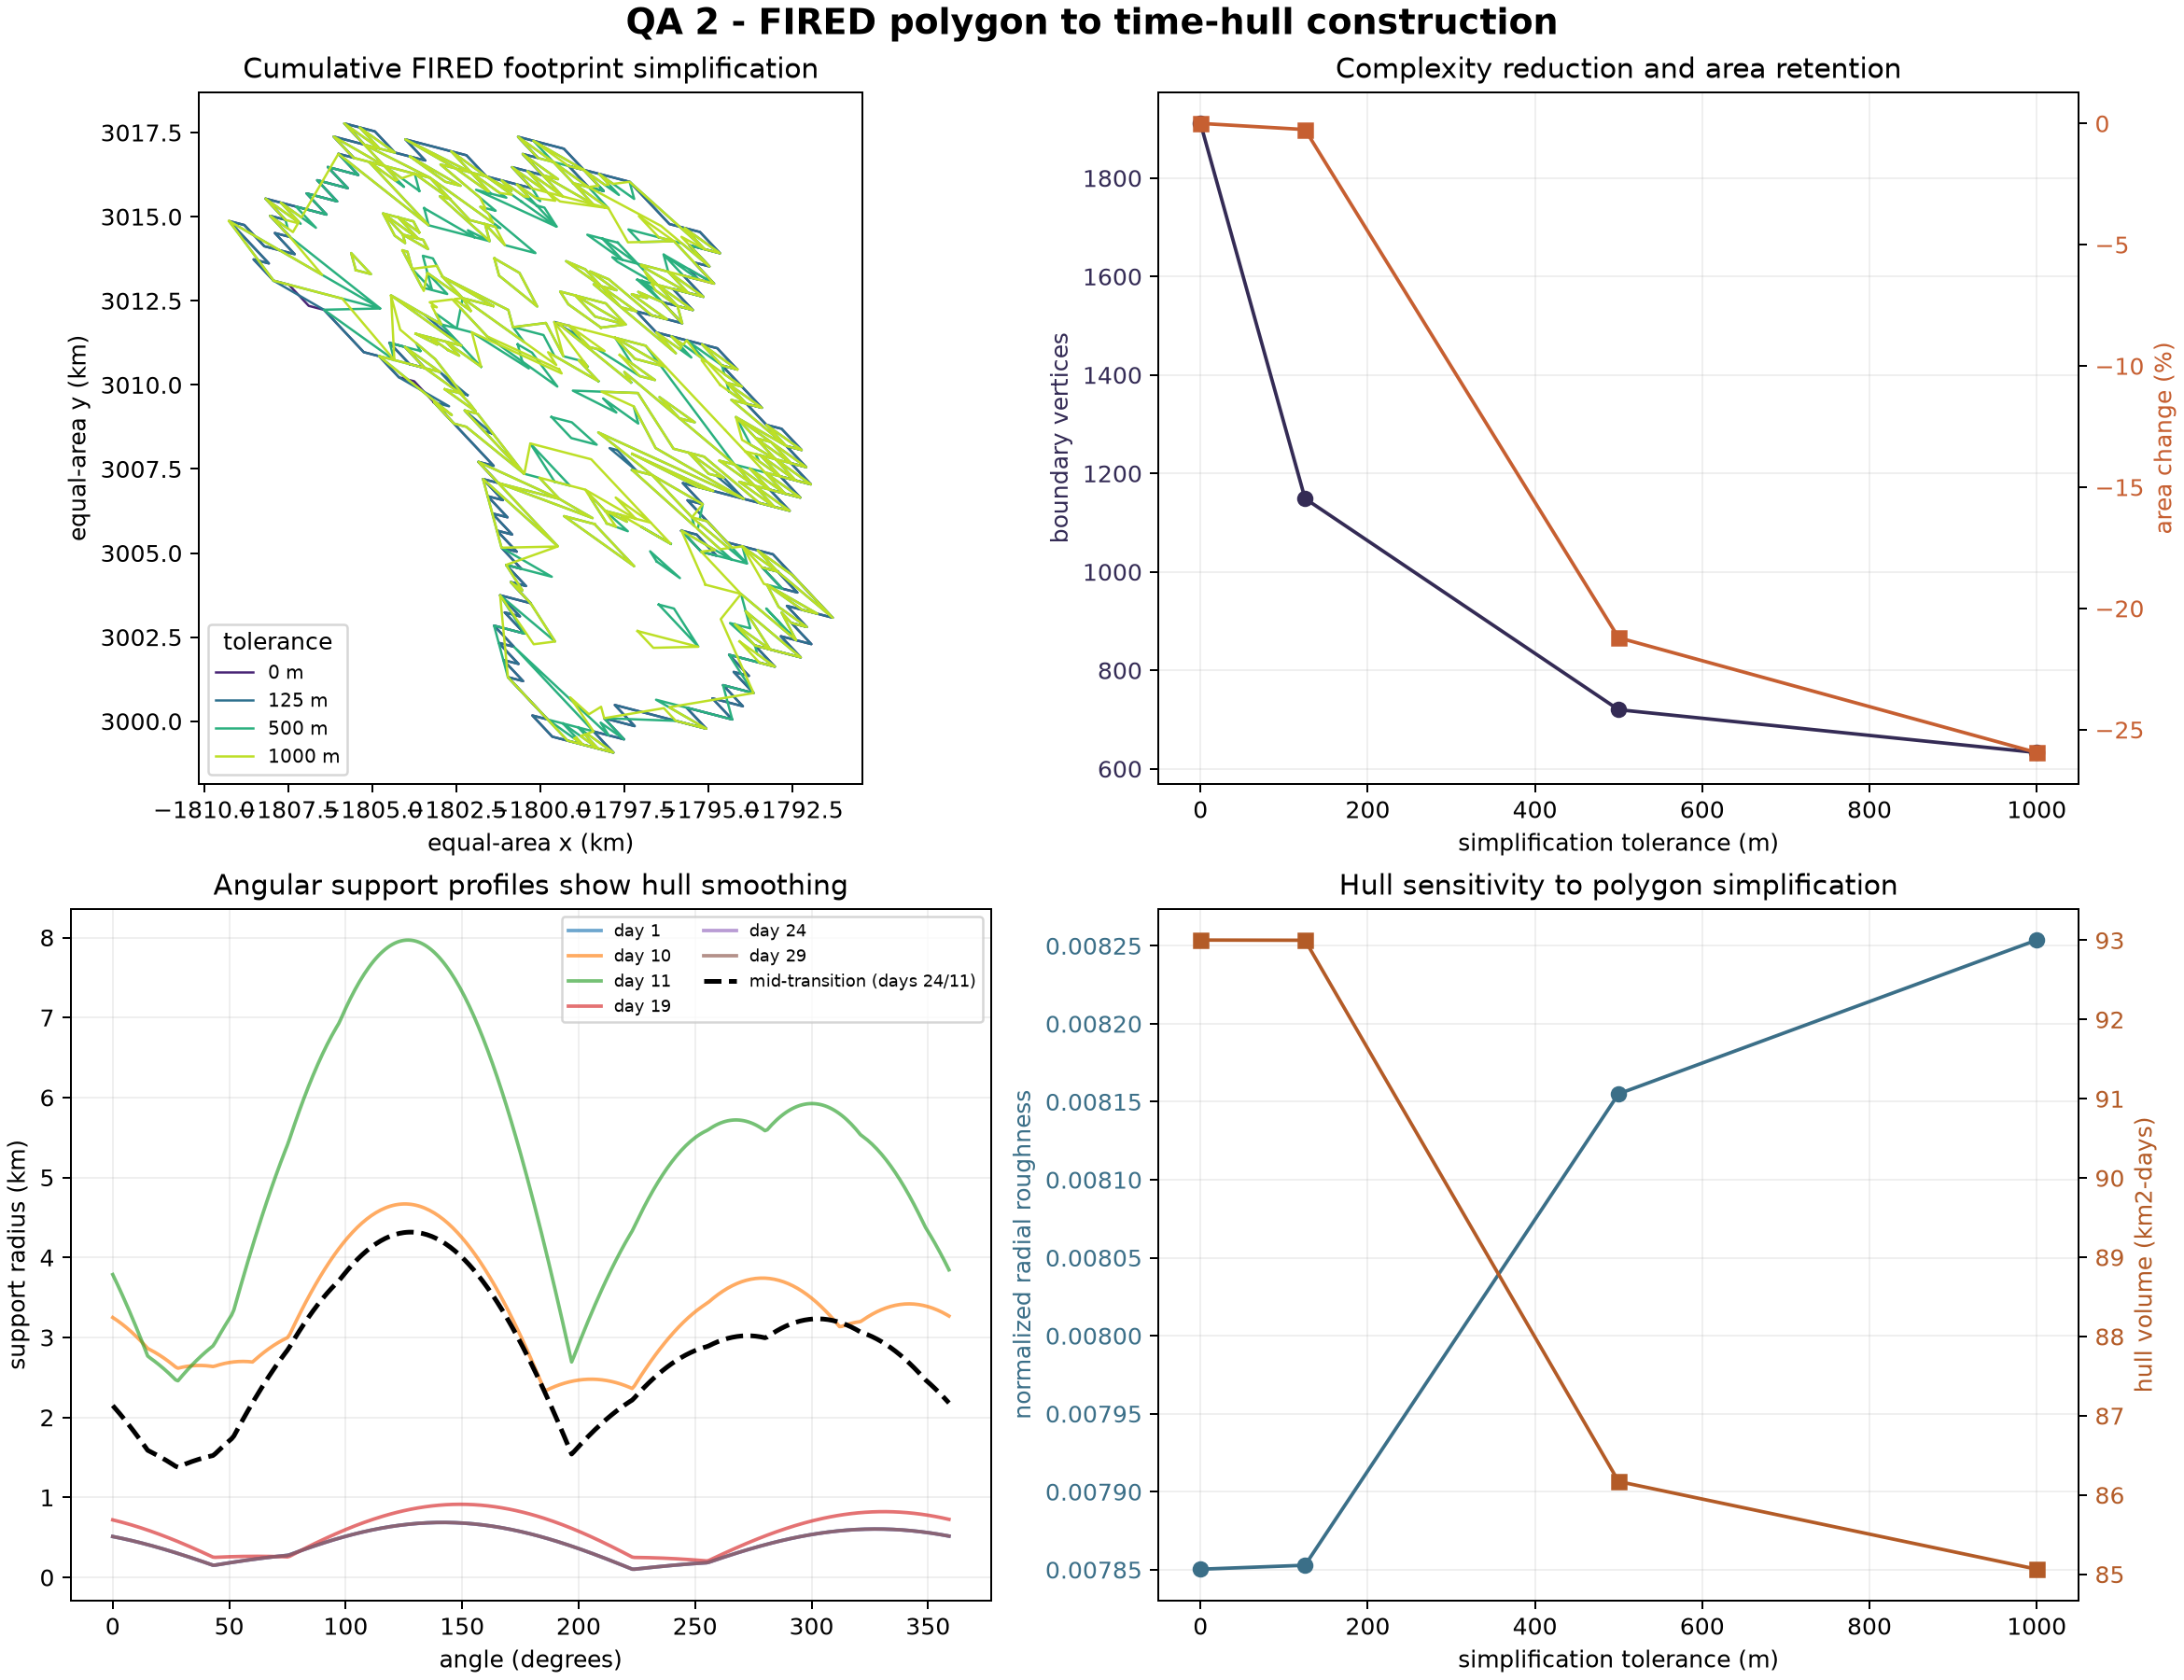
Look here. Source and simplified geometry agree within the declared production tolerance for this inspected event. This software check is separate from the population-level compositional sensitivity below.
How to read the geometry checks
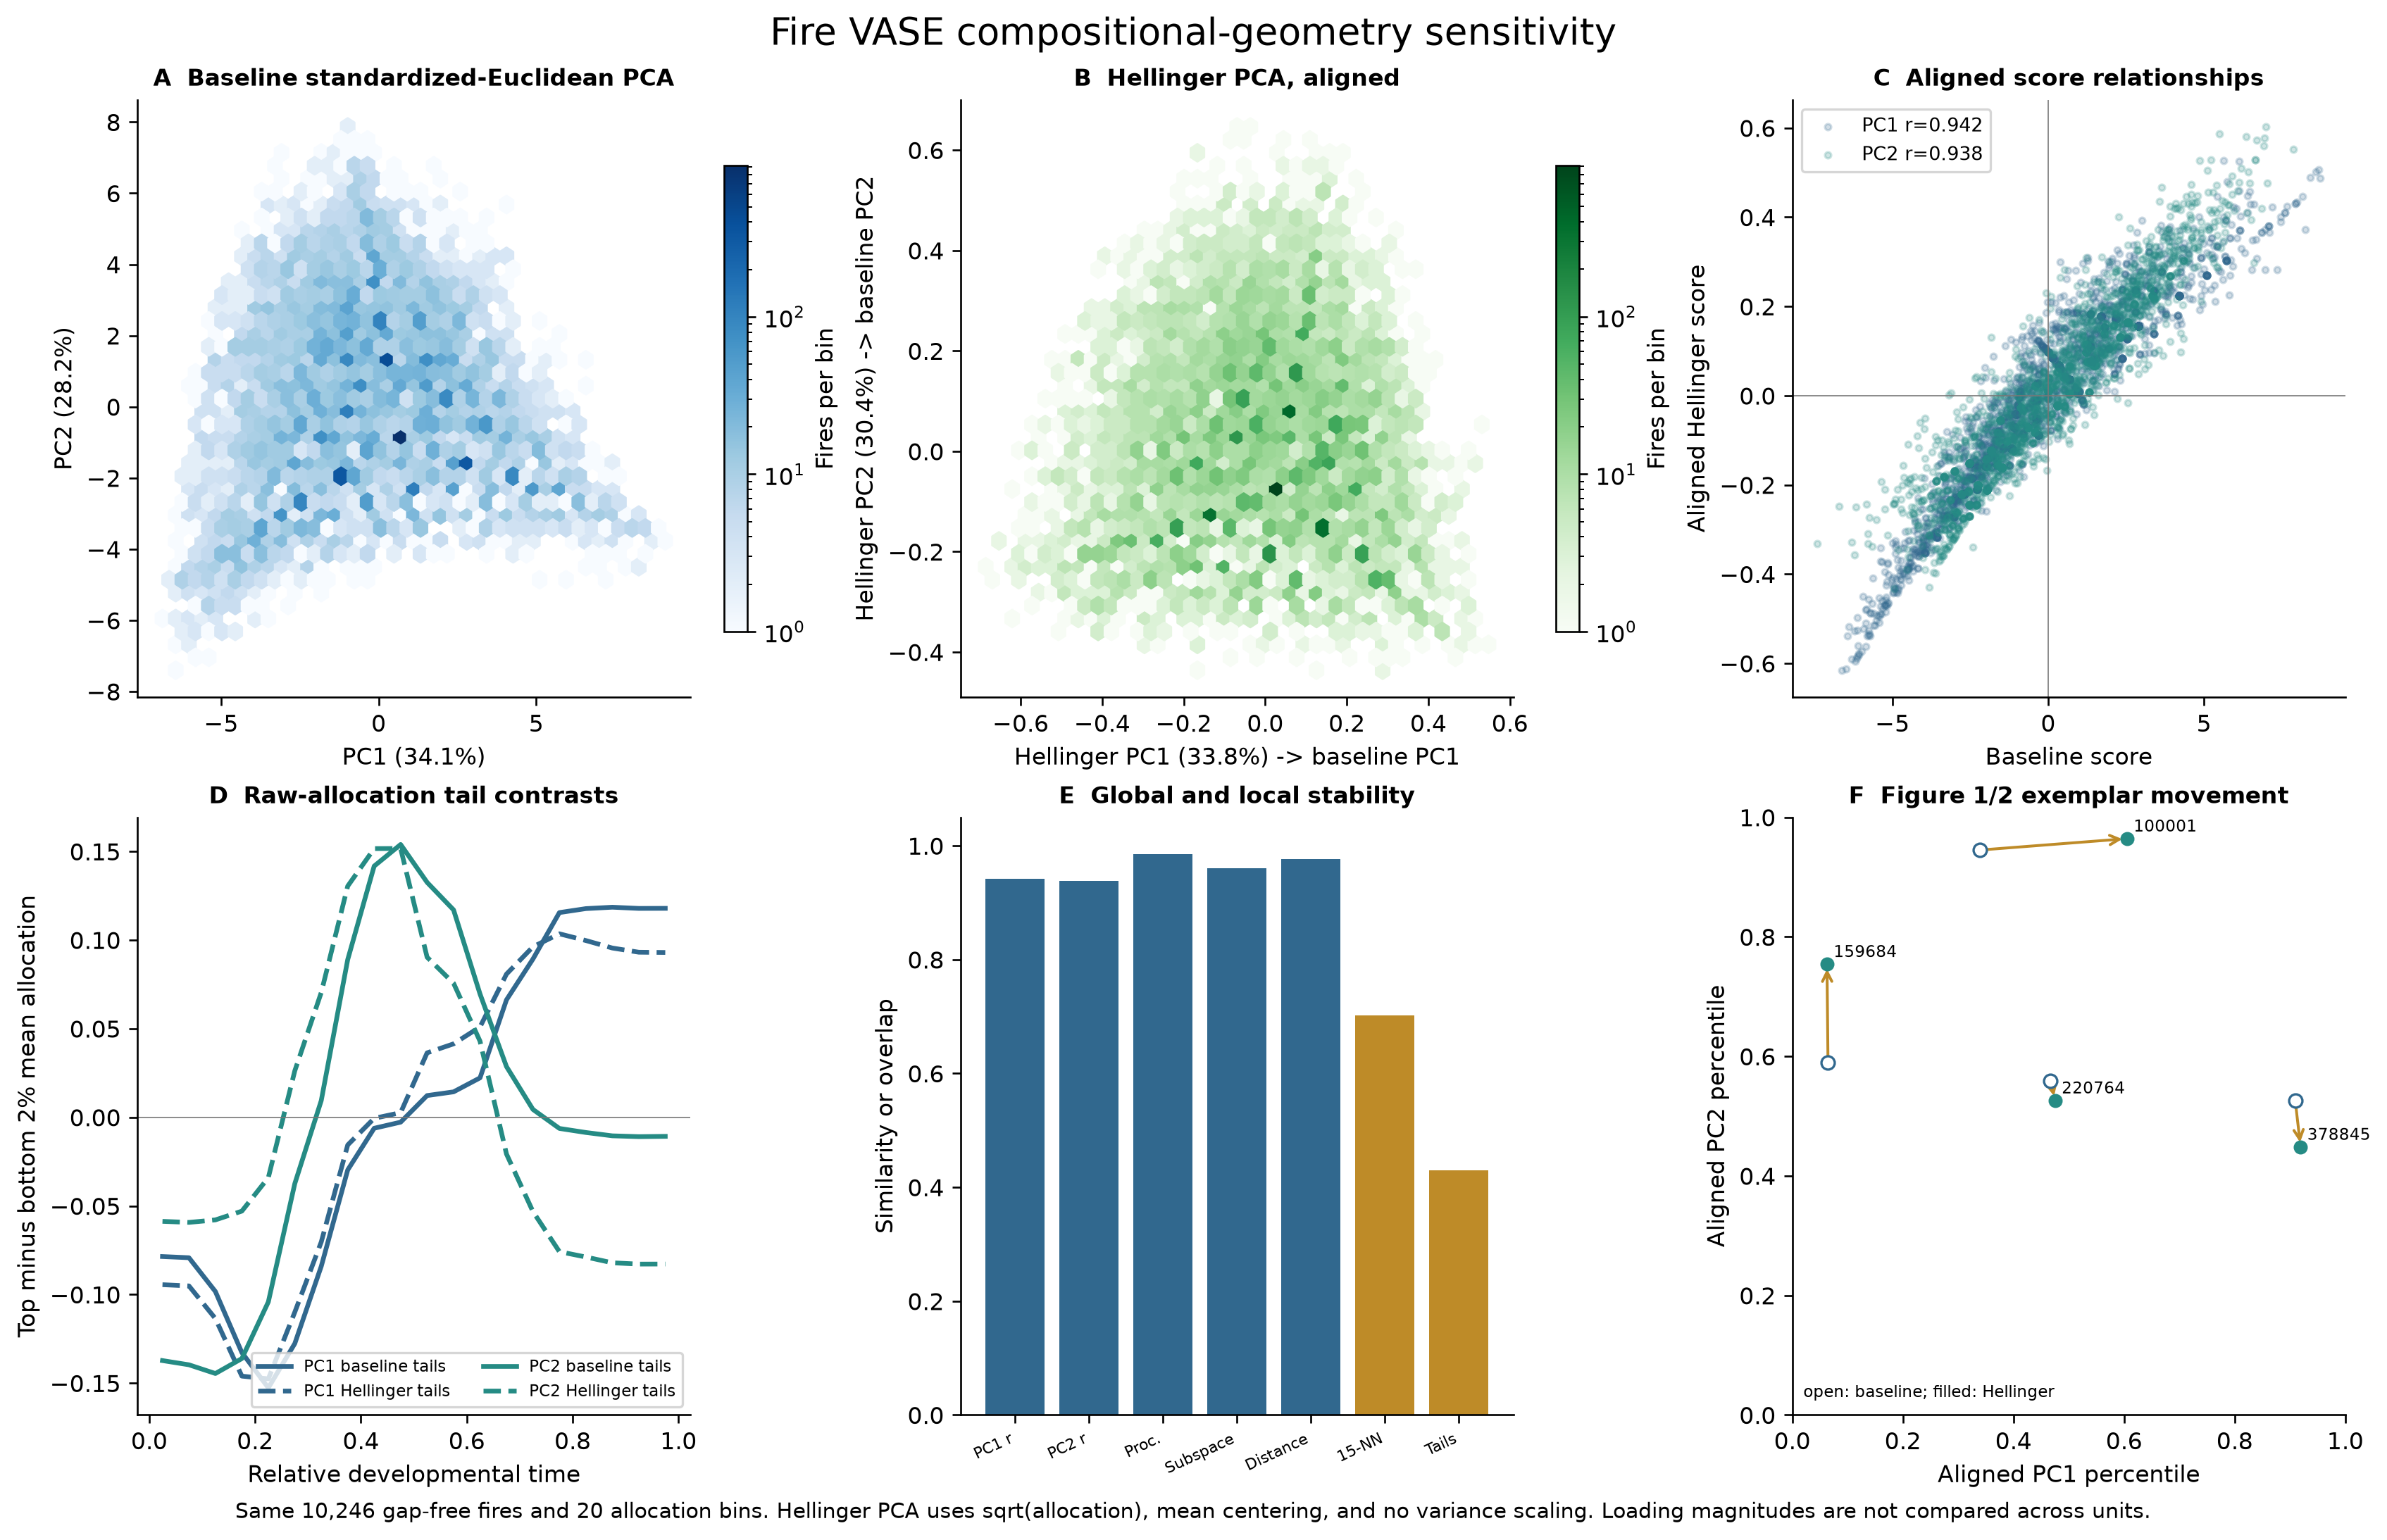
The early-versus-late axis disappears, or small methodological changes produce unrelated spaces.
The broad configuration persists, while exact neighbors, secondary contrasts, and extreme exemplars move.
Result. The leading early-versus-late gradient and broad configuration are stable. Exact neighbors, secondary contrasts, and extreme exemplars change. Positive null histories also compress, so compression alone is not uniquely biological. The production hull is reproduced to numerical precision, while alternative temporal averaging visibly changes it.
Geometry and hull audit · 3-D decision audit · Compositional sensitivity
Is temporal ordering actually informative?
Threat. Fire VASE might encode only the total and distribution of growth increments, not their sequence.
Challenge. Shuffle the complete increment multiset within each of 4,000 fires while preserving its count and reconstructed total.
Order-sensitive traits remain unchanged, or an order-insensitive invariant changes.
Front-loading, pulses, and reactivation change; entropy remains unchanged as required.
Result. Observed histories are more front-loaded (0.541 vs 0.500), less pulsed (1.249 vs 1.413), and less frequently reactivated (0.038 vs 0.120) than shuffled histories. Entropy stays unchanged, as required.
Could climate attribution be wrong?
Threat. A date, cell, centroid, or retrospective geometry error could create spurious weather associations.
Challenge. Recompute event dates and centroid values from FIRED and gridMET; compare centroid with fractional polygon–pixel overlap; sample next-day models at the day’s newly burned-area centroid; independently compare packed gridMET values with the NCAR mirror.
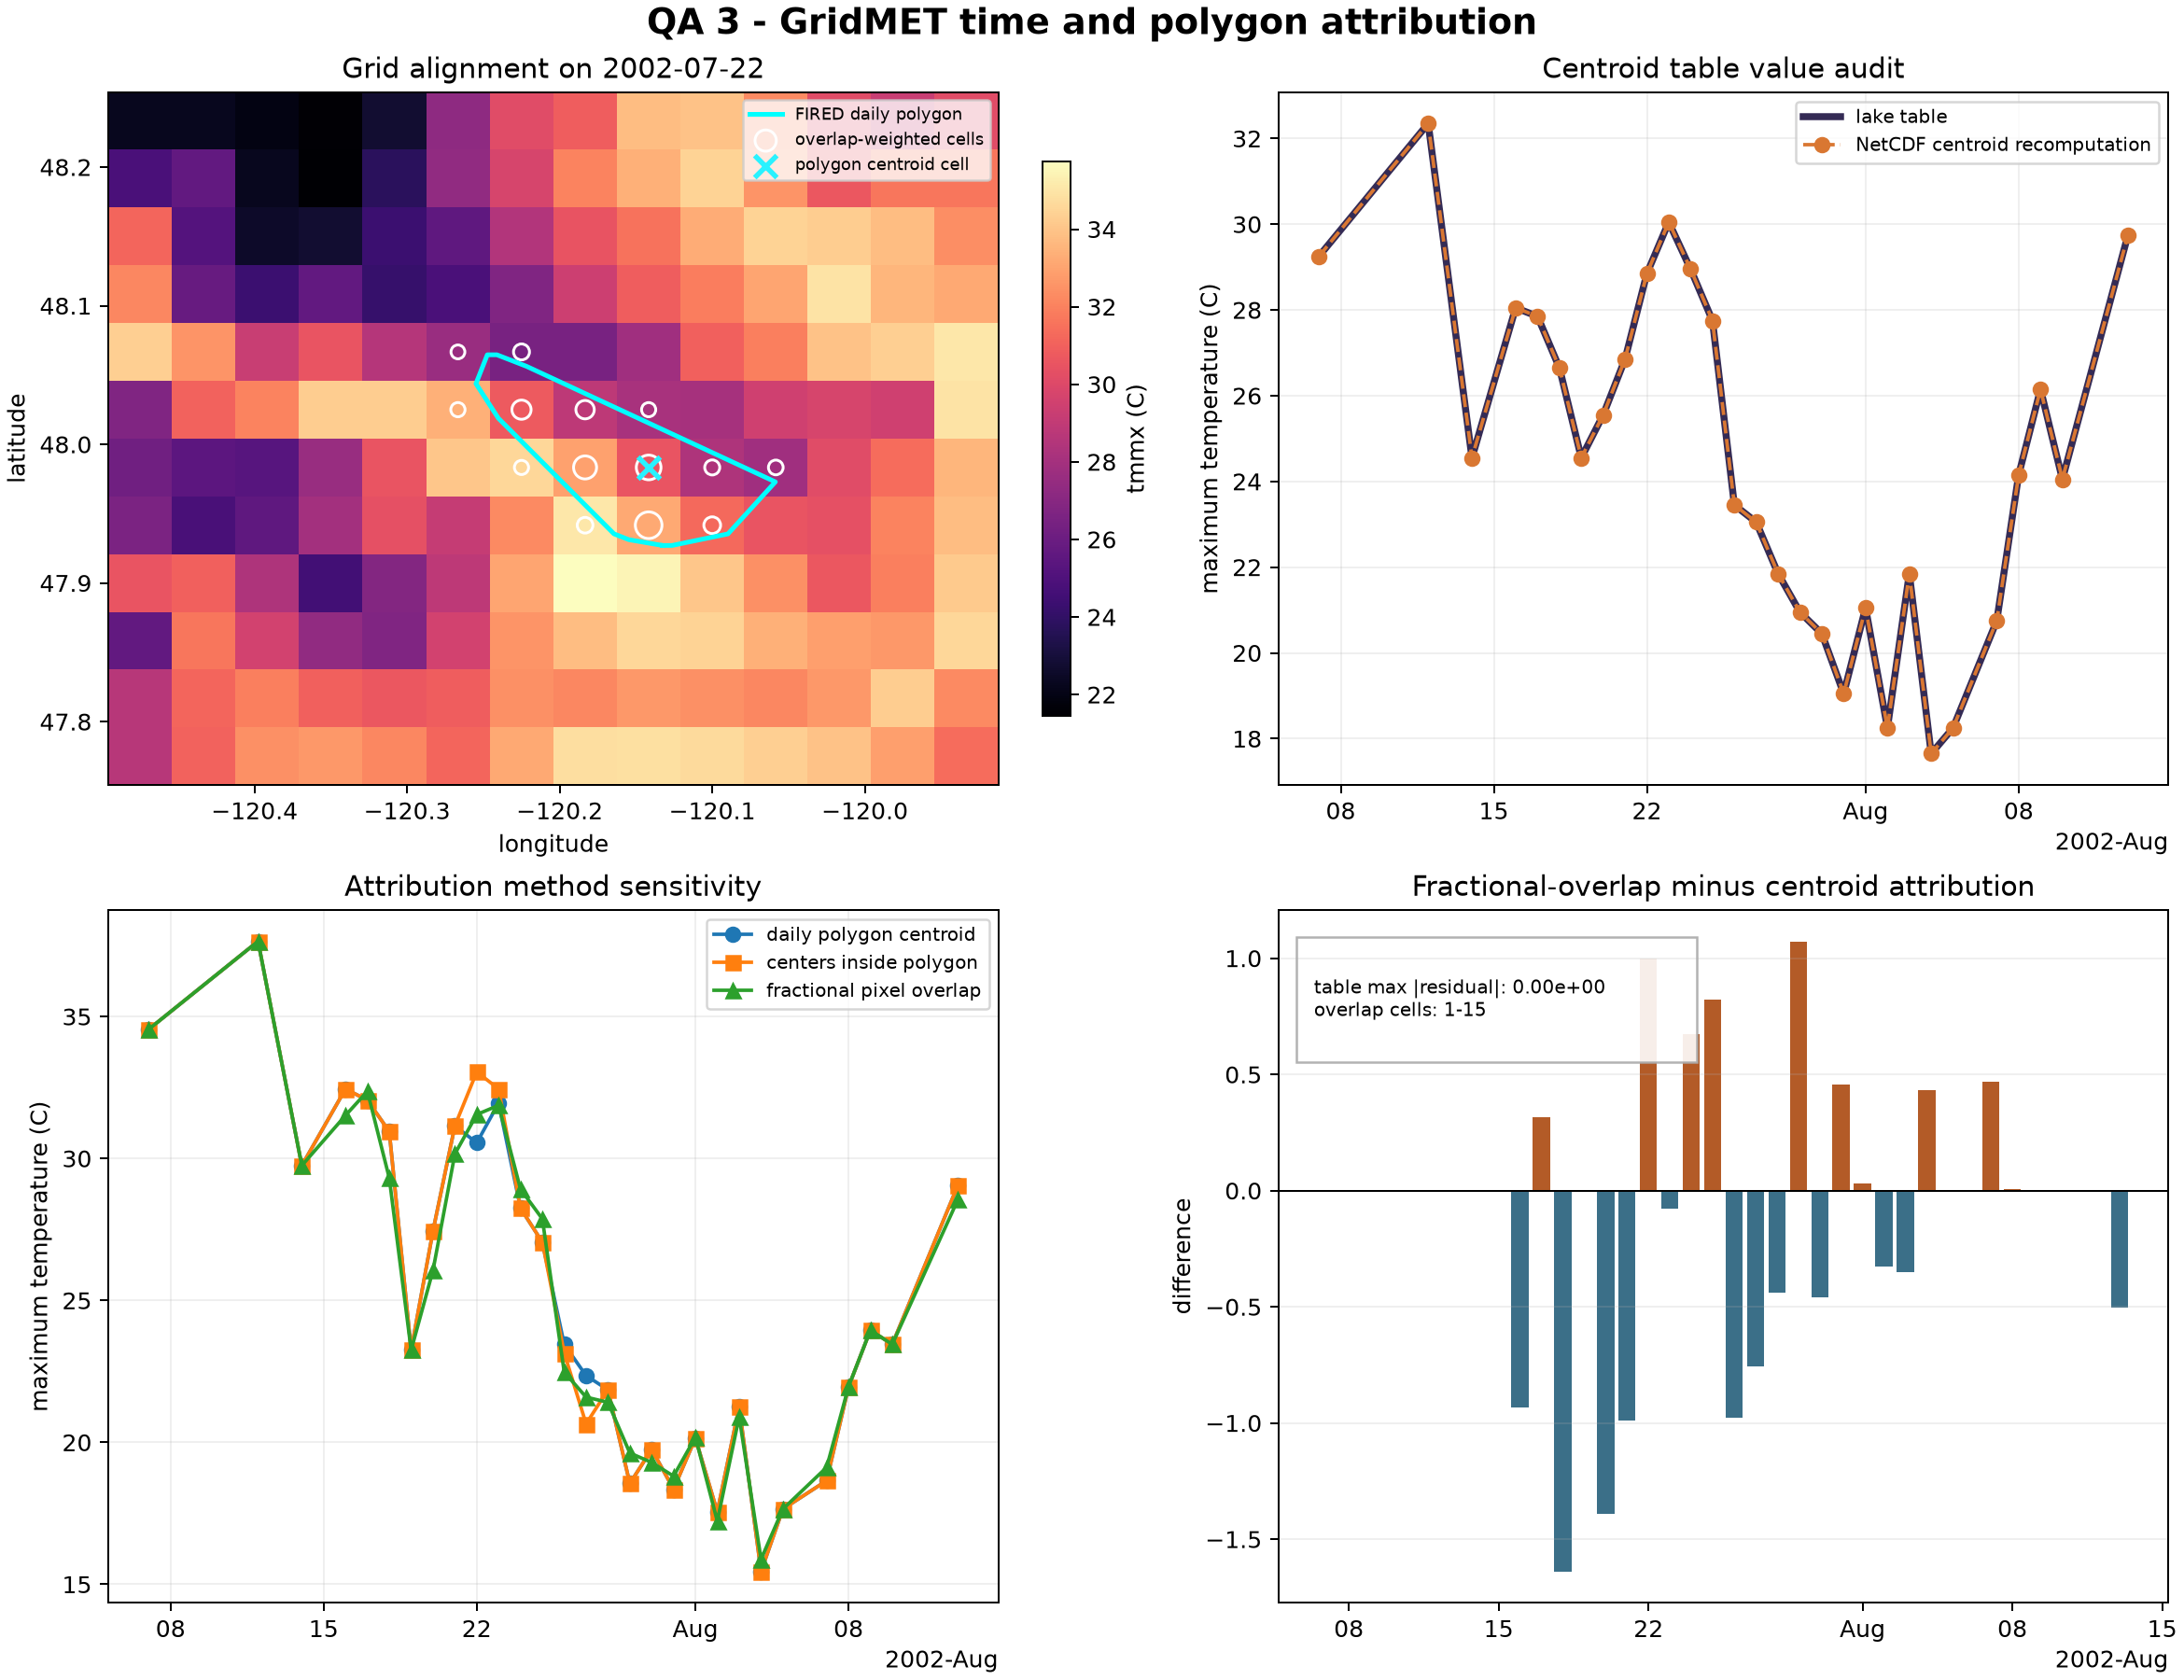
Look here. The audit checks dates and values against declared sources, then makes the centroid-versus-overlap sensitivity visible rather than treating one spatial summary as universally correct.
Missing source dates, disagreement with the independent mirror, or use of future/static geometry in next-day models.
Dates and packed values agree; day-specific geometry removes one look-ahead route. Sub-grid exposure uncertainty remains.
Result. Published tables reproduce exactly for the inspected event, source dates are present in gridMET, and external packed values agree. Day-specific geometry removes one spatial look-ahead pathway. Fractional overlap can differ from centroid attribution and remains an explicit sensitivity—not a hidden replacement.
Climate attribution · External sources
Does the implementation reproduce the intended transformations?
Threat. Pipe execution, lazy loading, cube serialization, geometry, or source joins could silently diverge from the intended methods.
Challenge. Six isolated modules recompute the most failure-prone handoffs on the same real FIRED event. Each writes machine-readable metrics and a plot; the suite writes a manifest and collated report.
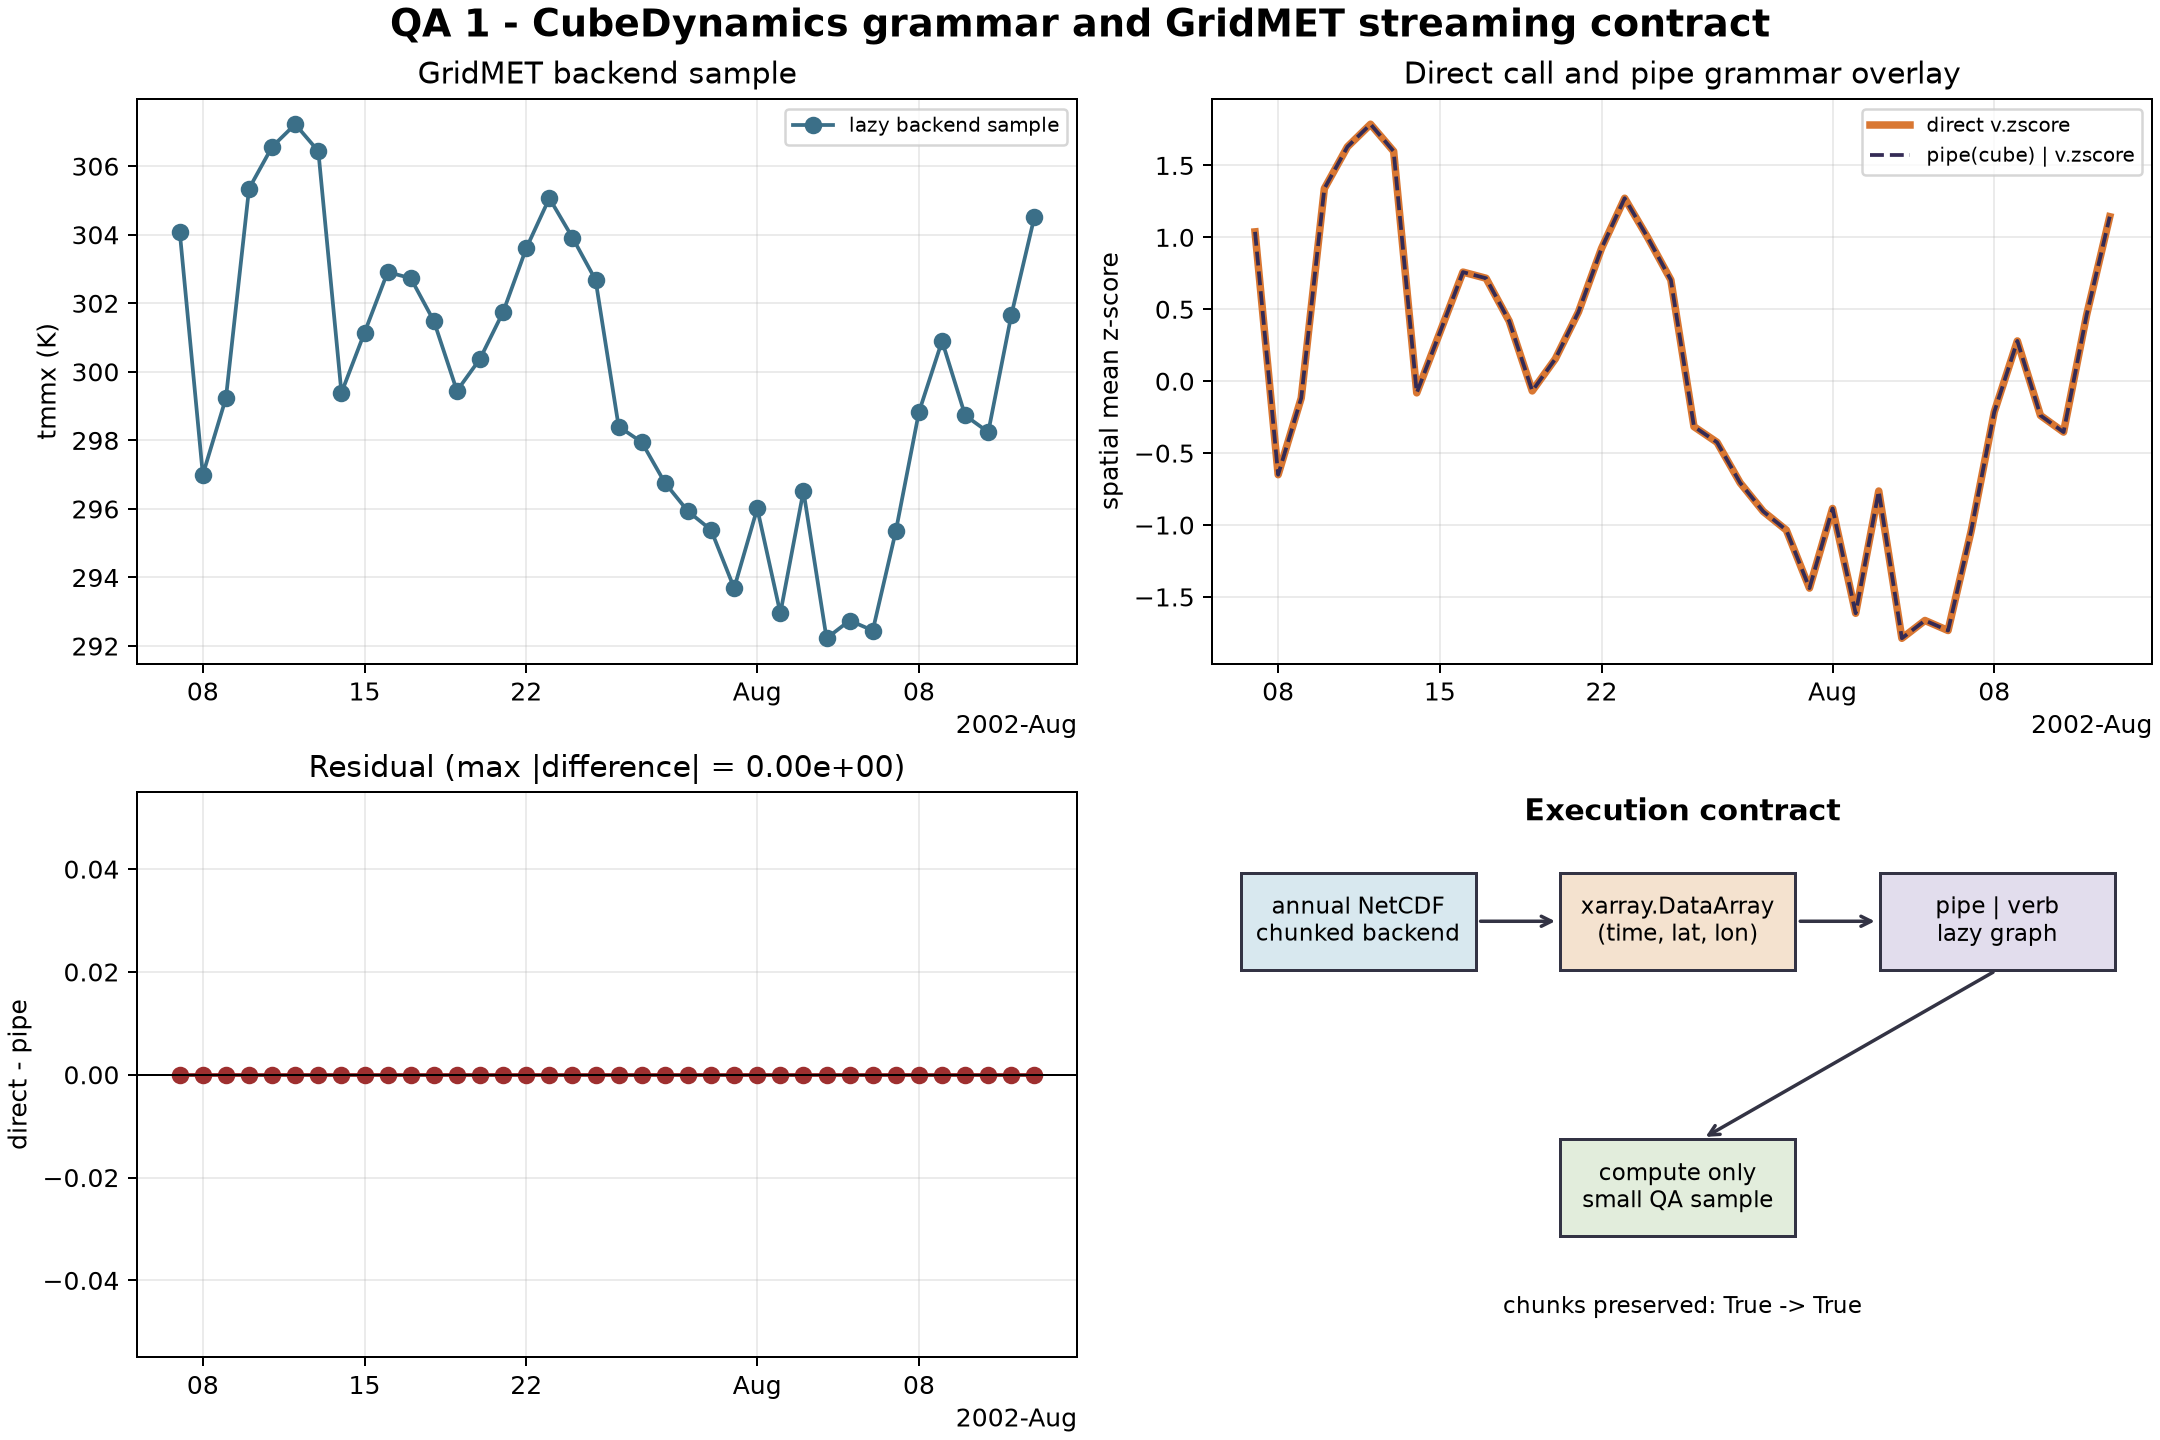
Look here. Direct and pipe-style transformations agree, while lazy access remains chunked. This checks a failure-prone software handoff; it does not validate the ecological interpretation by itself.
| Module | Published status | What is recomputed |
|---|---|---|
| Pipe and stream | PASS | Direct and pipe-style operations; lazy chunks |
| Cube and HTML | PASS | Coordinates, every time plane, HTML faces/interiors, pixels, hashes |
| Geometry and hull | PASS | Simplified polygons, support profiles, hull metrics |
| 3-D hull decisions | PASS | Production mesh and temporal-averaging alternatives |
| Climate attribution | PASS | Dates, centroid values, polygon–pixel overlaps |
| External sources | PASS | NCAR gridMET values and FIRED event/daily geometry |
Download the collated QA report
Do the tests detect deliberately incorrect cases?
Threat. A validator that always passes is not evidence.
Challenge. Reverse latitude, scramble time, drop a day, and run the geometry threshold against a real FIRED event known to exceed it.
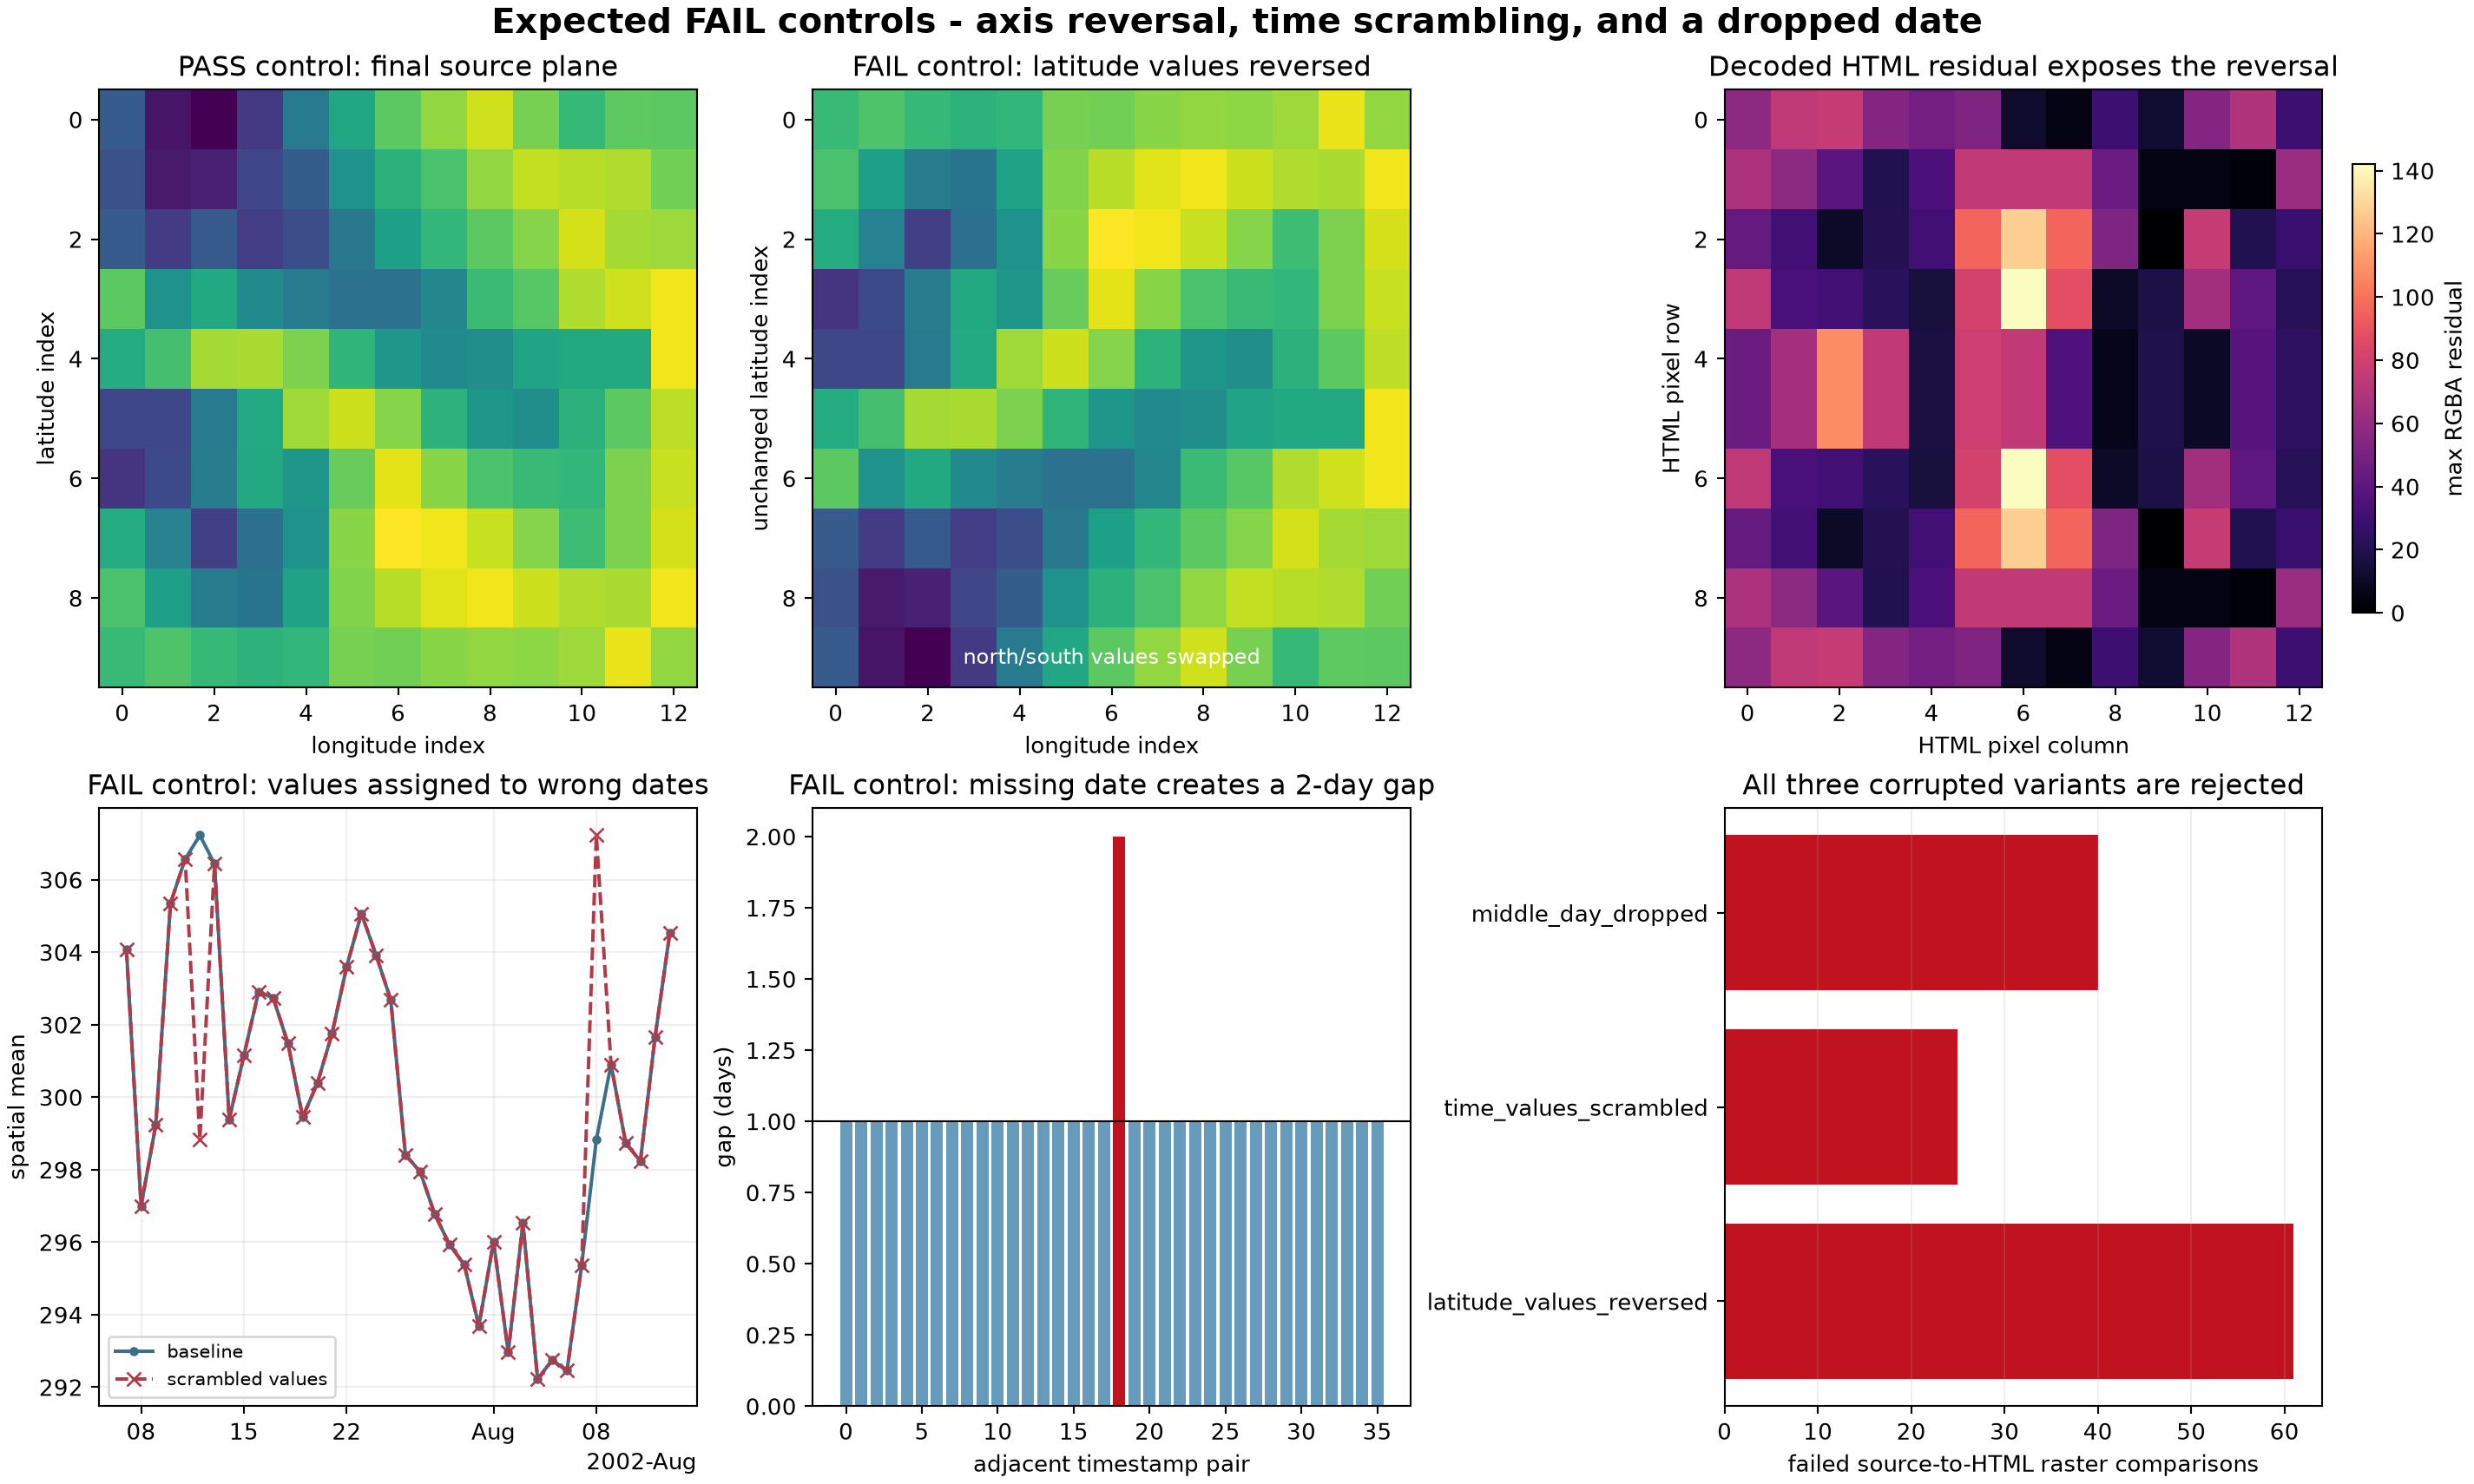
Corrupted inputs pass, or clean and bad cases are indistinguishable.
The clean cube passes and every deliberate corruption fails the intended validator.
Result. The clean cube passes; all three corrupted cubes fail the intended checks; the real geometry case fails the declared 125-m area-change tolerance. These are expected failures and are kept separate from the six production results.
Inspect expected-failure controls
Reproduce the suite
uv run python scripts/run_validation.py --external --publish-docs
PYTHONPATH=src:scripts:. .venv/bin/pytest -q
The first command requires the materialized data lake and network access for the independent mirror check. The validation notebook exposes one executable section per module.
Open the validation notebook All reproducibility routes AI use and scientific accountability
Scope and provenance
The 6/6 status comes from output/validation/validation_manifest.json.
Population-level claims come from the current v2 manuscript and
analysis/scientific_validation/. The correction record
documents superseded analyses and the final full-suite test result.