Recent state explains much more than weather alone
Finding 03 · Held-out subsequent-growth models
Weather matters, but measured weather explains relatively little additional variation in the next observed growth increment compared with recent fire state in these analyses.
Question
For exact next-calendar-day transitions, how much does day-specific weather add after the fire’s recent developmental state is known?
Answer
The region-held-out autoregressive state model explains 44.8% of variation. Adding weather raises R² by 0.5 percentage points; allowing the full set of weather × state interactions raises it by 1.8 percentage points above the same baseline.
First ask what weather predicts by itself
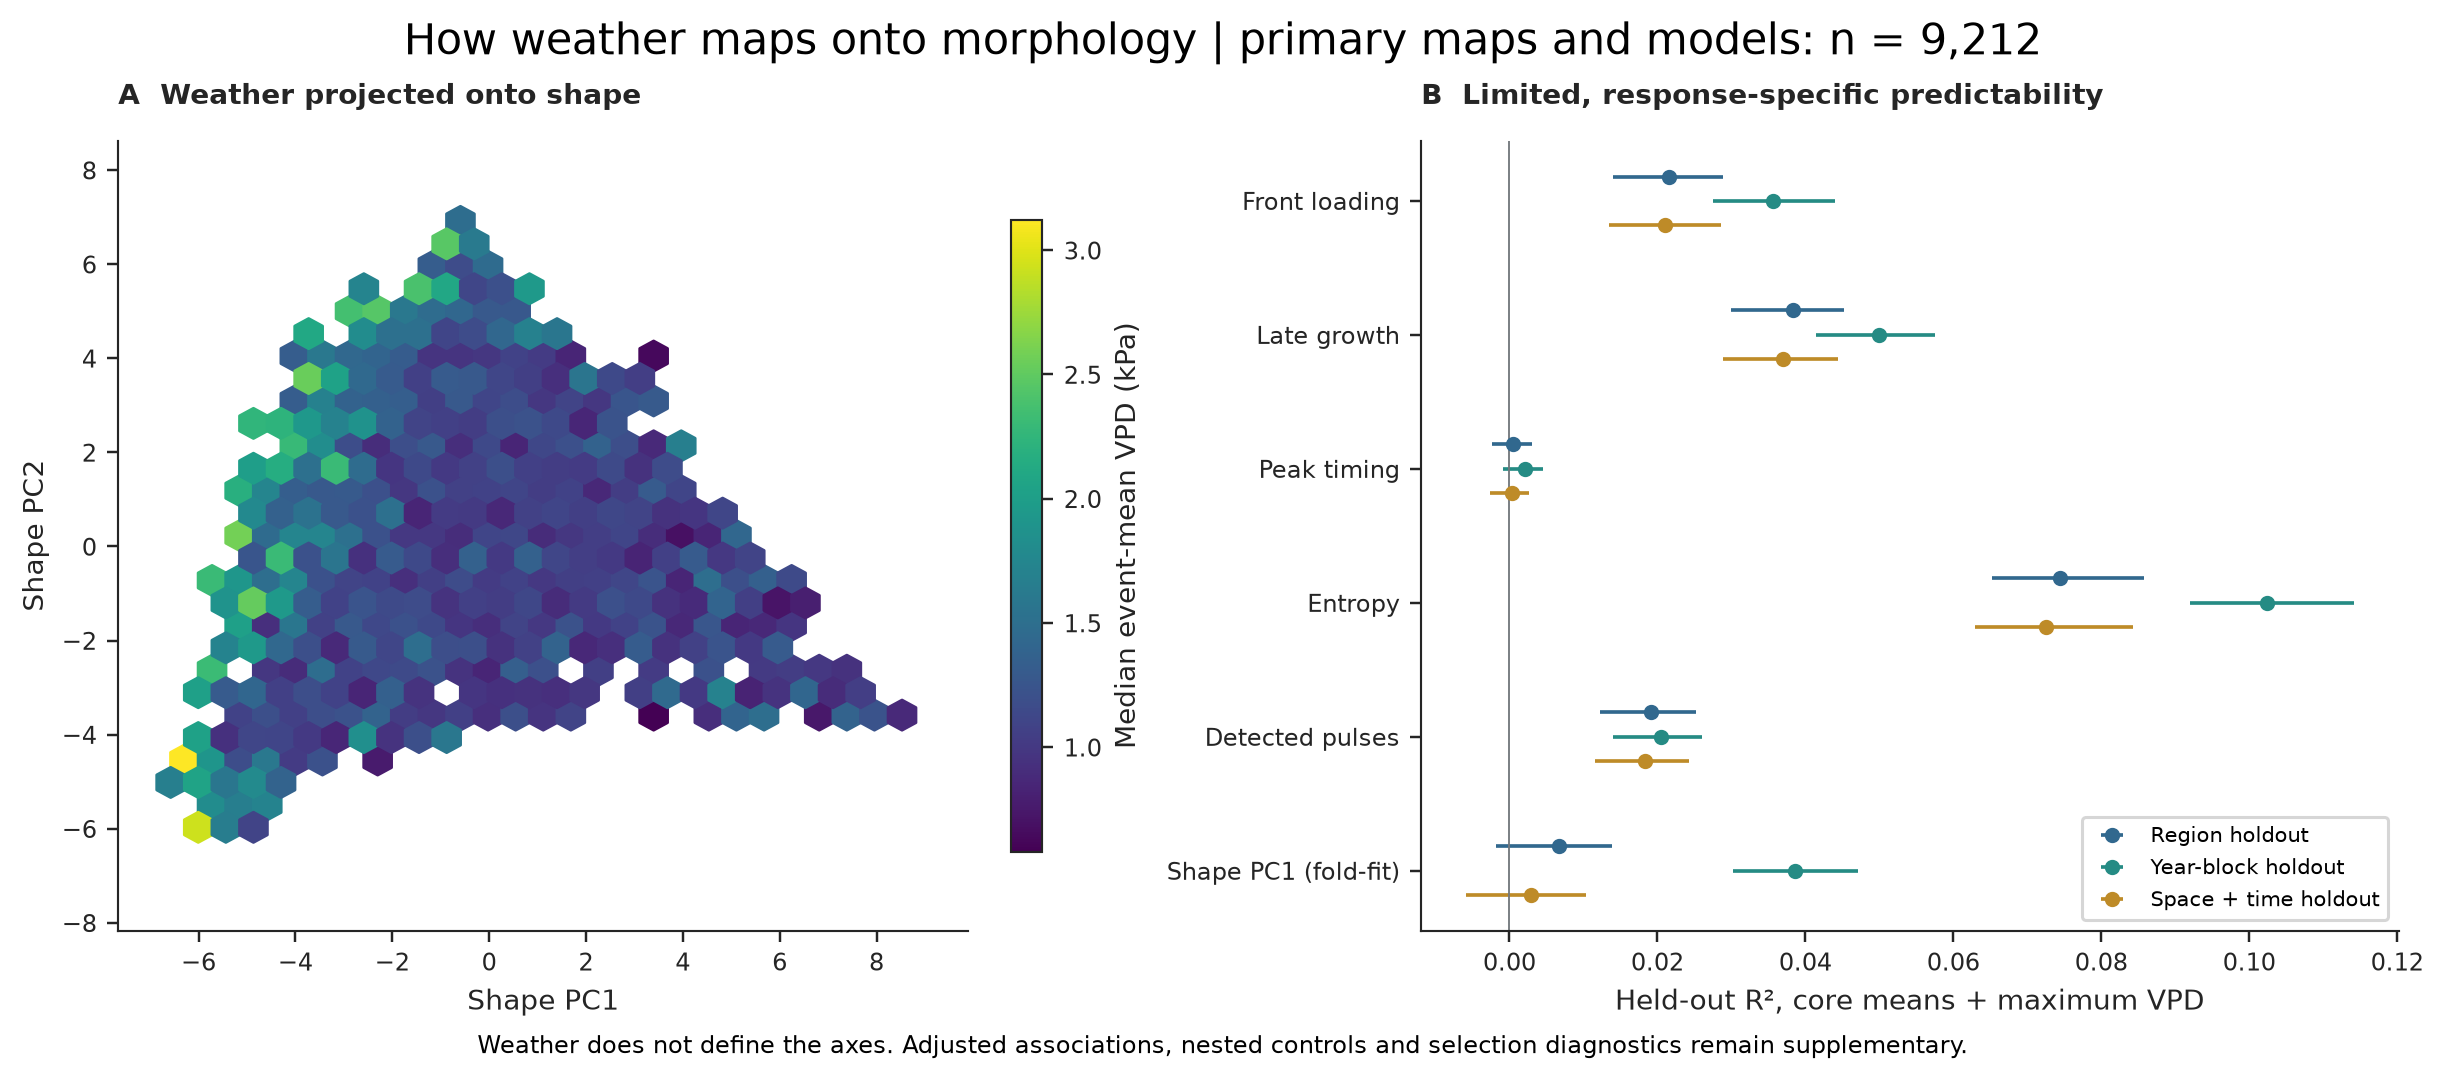
What to notice. Weather is projected after the developmental axes exist. The color field is not a clean shape gradient, and held-out skill varies by response and blocking scheme. Technical caption
How to read Figure 3
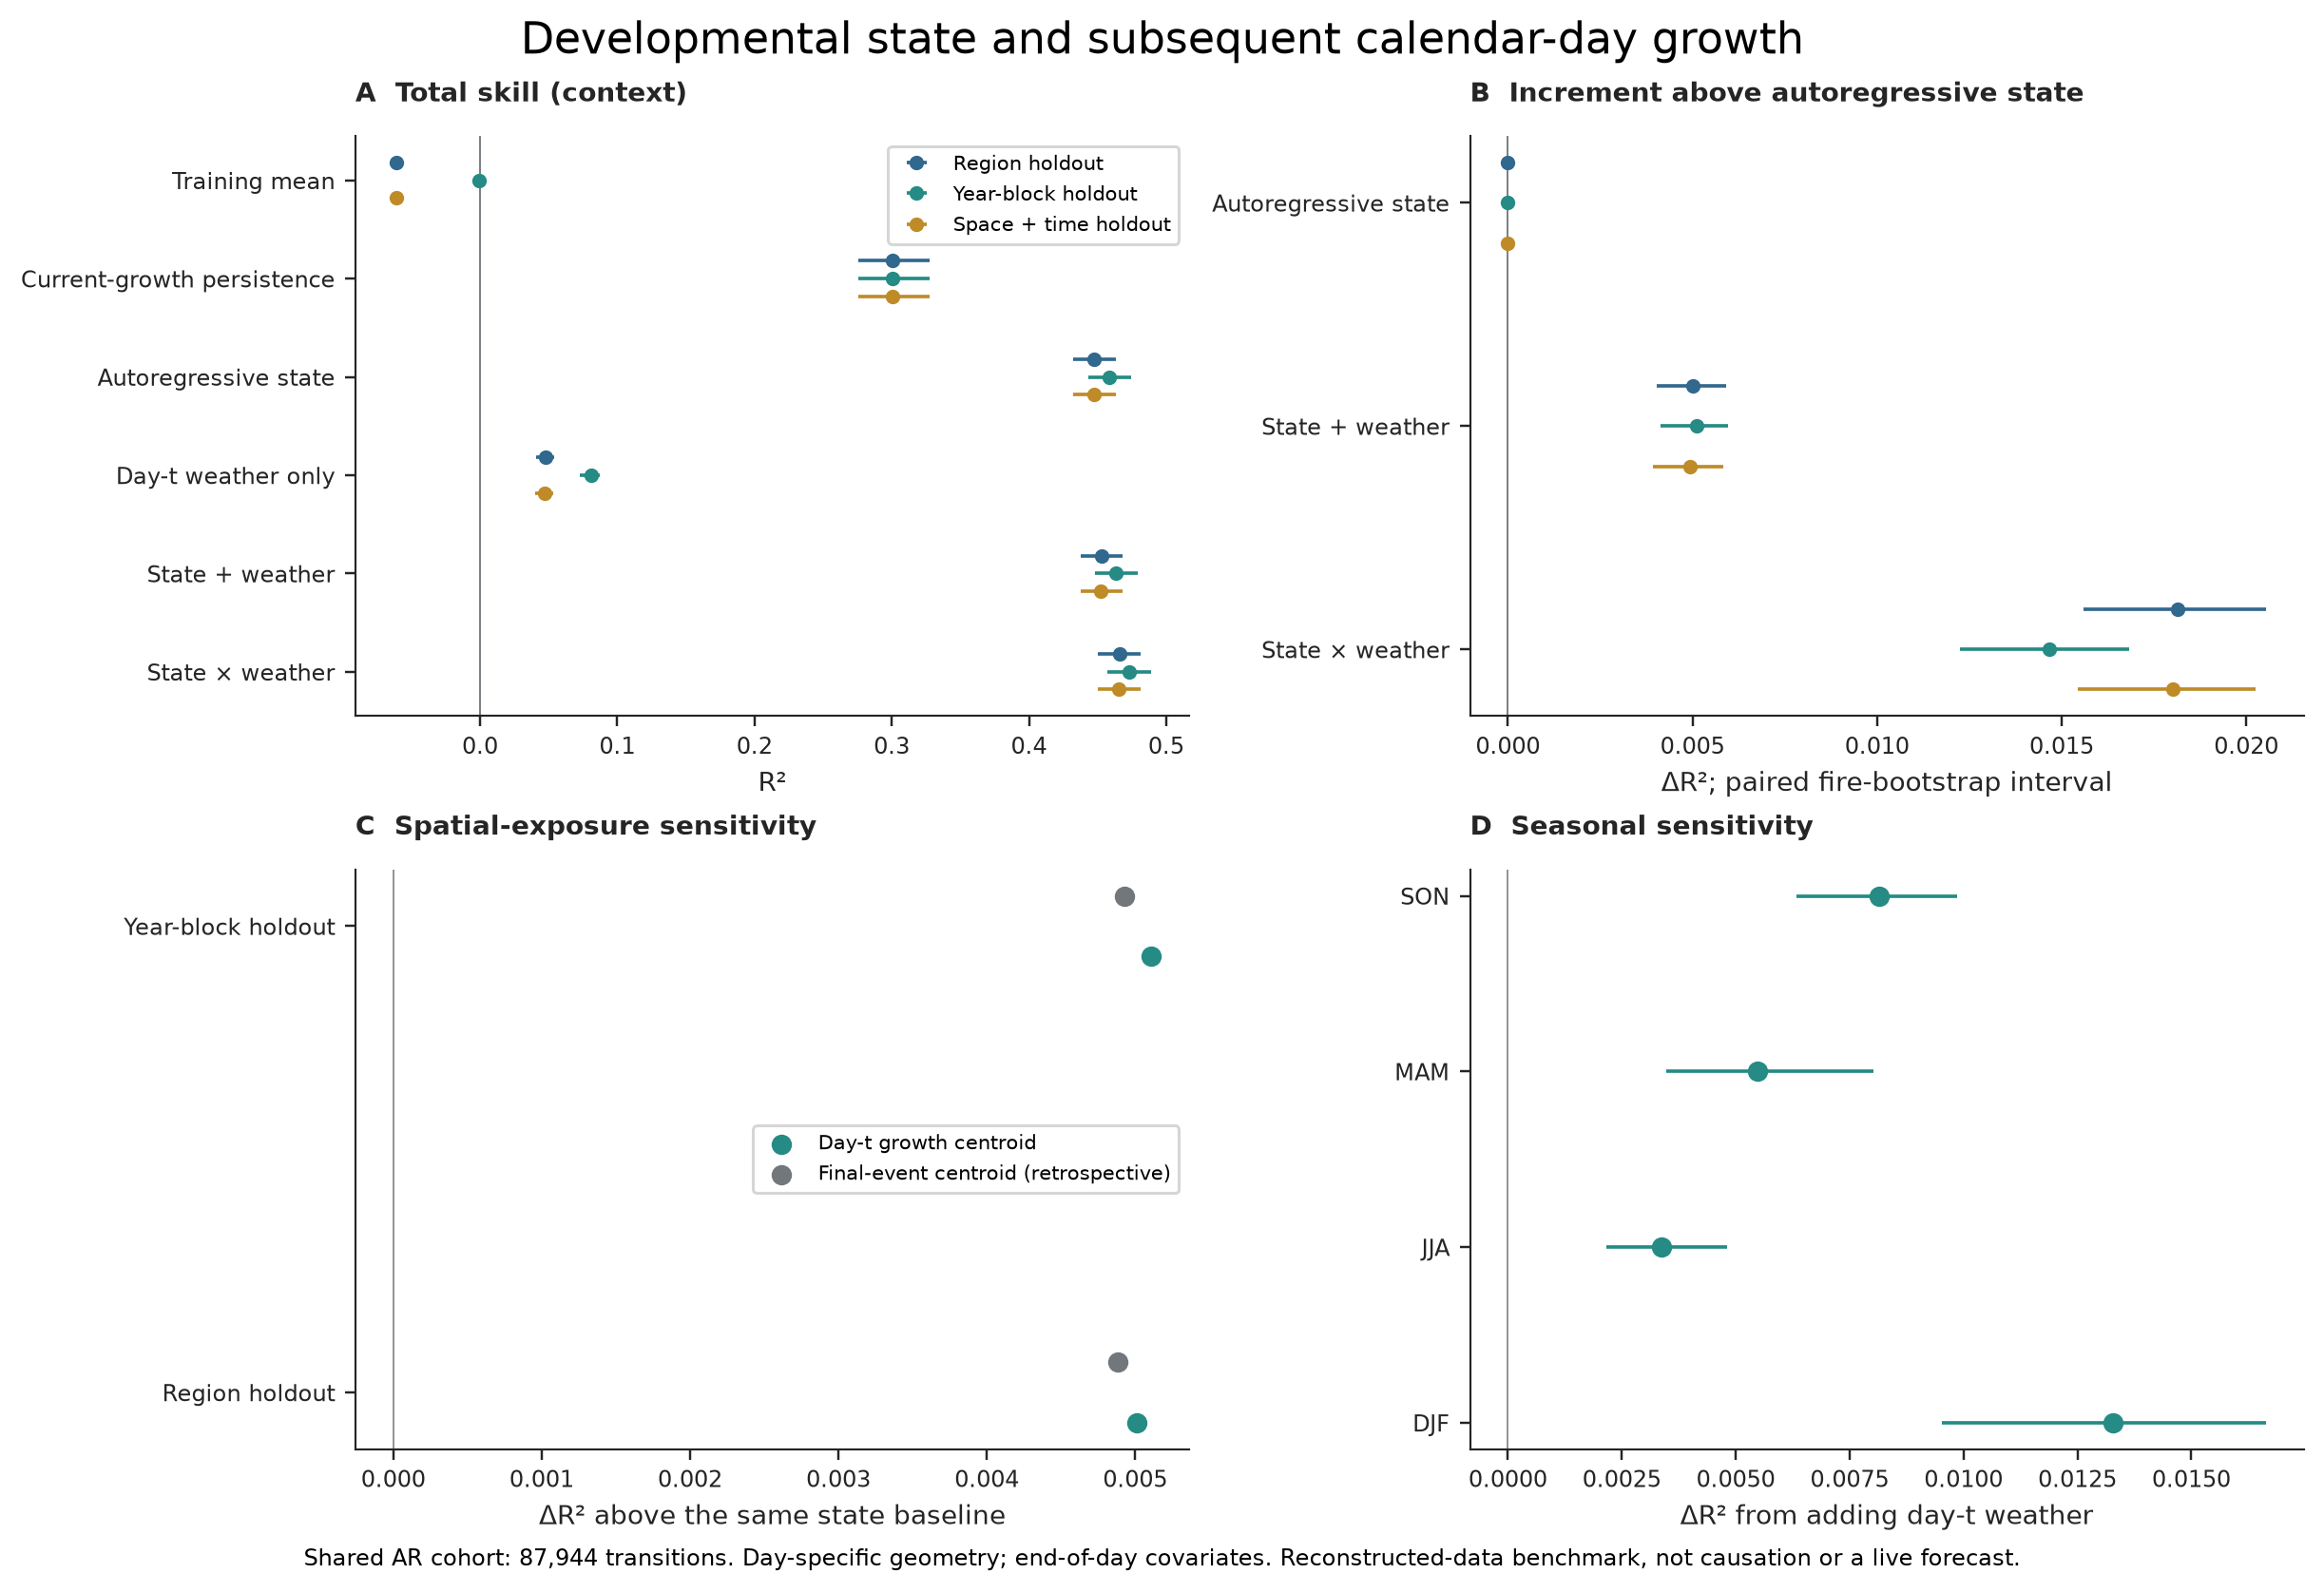
What to notice. The autoregressive state points sit near R² 0.45; weather-only prediction is much lower. The right panels show the smaller increment that weather contributes above state, including sensitivity to spatial exposure and season. The common cohort contains 87,944 transitions from 31,700 fires. Technical caption
How to read Figure 4
Challenge this result. Incorrect dates, static centroids, or region leakage could create artificial weather skill. See the date, geometry, external-source, and blocked-fold tests →
Evidence trail
What we measured
Every comparator uses exact one-day transitions and the same cohort. The baseline contains current growth, previous-calendar-day growth, cumulative observed area, and elapsed time. Day-t weather is sampled at that day’s newly burned-area centroid. Models are evaluated by held-out region, year block, and their stricter intersection.
How well does it hold up?
| Holdout | State R² | + weather ΔR² | + interactions ΔR² |
|---|---|---|---|
| Region | 0.448 | 0.005 | 0.018 |
| Year block | 0.458 | 0.005 | 0.015 |
| Space + time | 0.448 | 0.005 | 0.018 |
VPD-specific products add 0.006–0.012 R² above the other interactions across four blocking schemes; the regional increment is 0.0118 with a conditional fire-bootstrap interval of 0.0097–0.0138. Coefficients vary by region, size, and partial edge years, and small-fire subsets can have poor absolute prediction despite a positive increment.
What this does not show
This is not evidence that weather is unimportant. It is evidence that the measured, roughly 4-km daily weather variables add little predictive skill after recent reconstructed state is known in this cohort and model. The result is retrospective, non-causal, and not a live forecast. Satellite latency, event delineation, time-zone alignment, local heterogeneity, directional wind, active-edge exposure, fuels, terrain, and suppression are not resolved.
Technical details
See weather, prediction, and uncertainty and the state-analysis correction record.